# Dashboard
It’s better to interact with it at Tableau Public (Link). I’d be much appreciate it if you like it, add it as your favorite or nominate for Viz of the Day!
# Overview
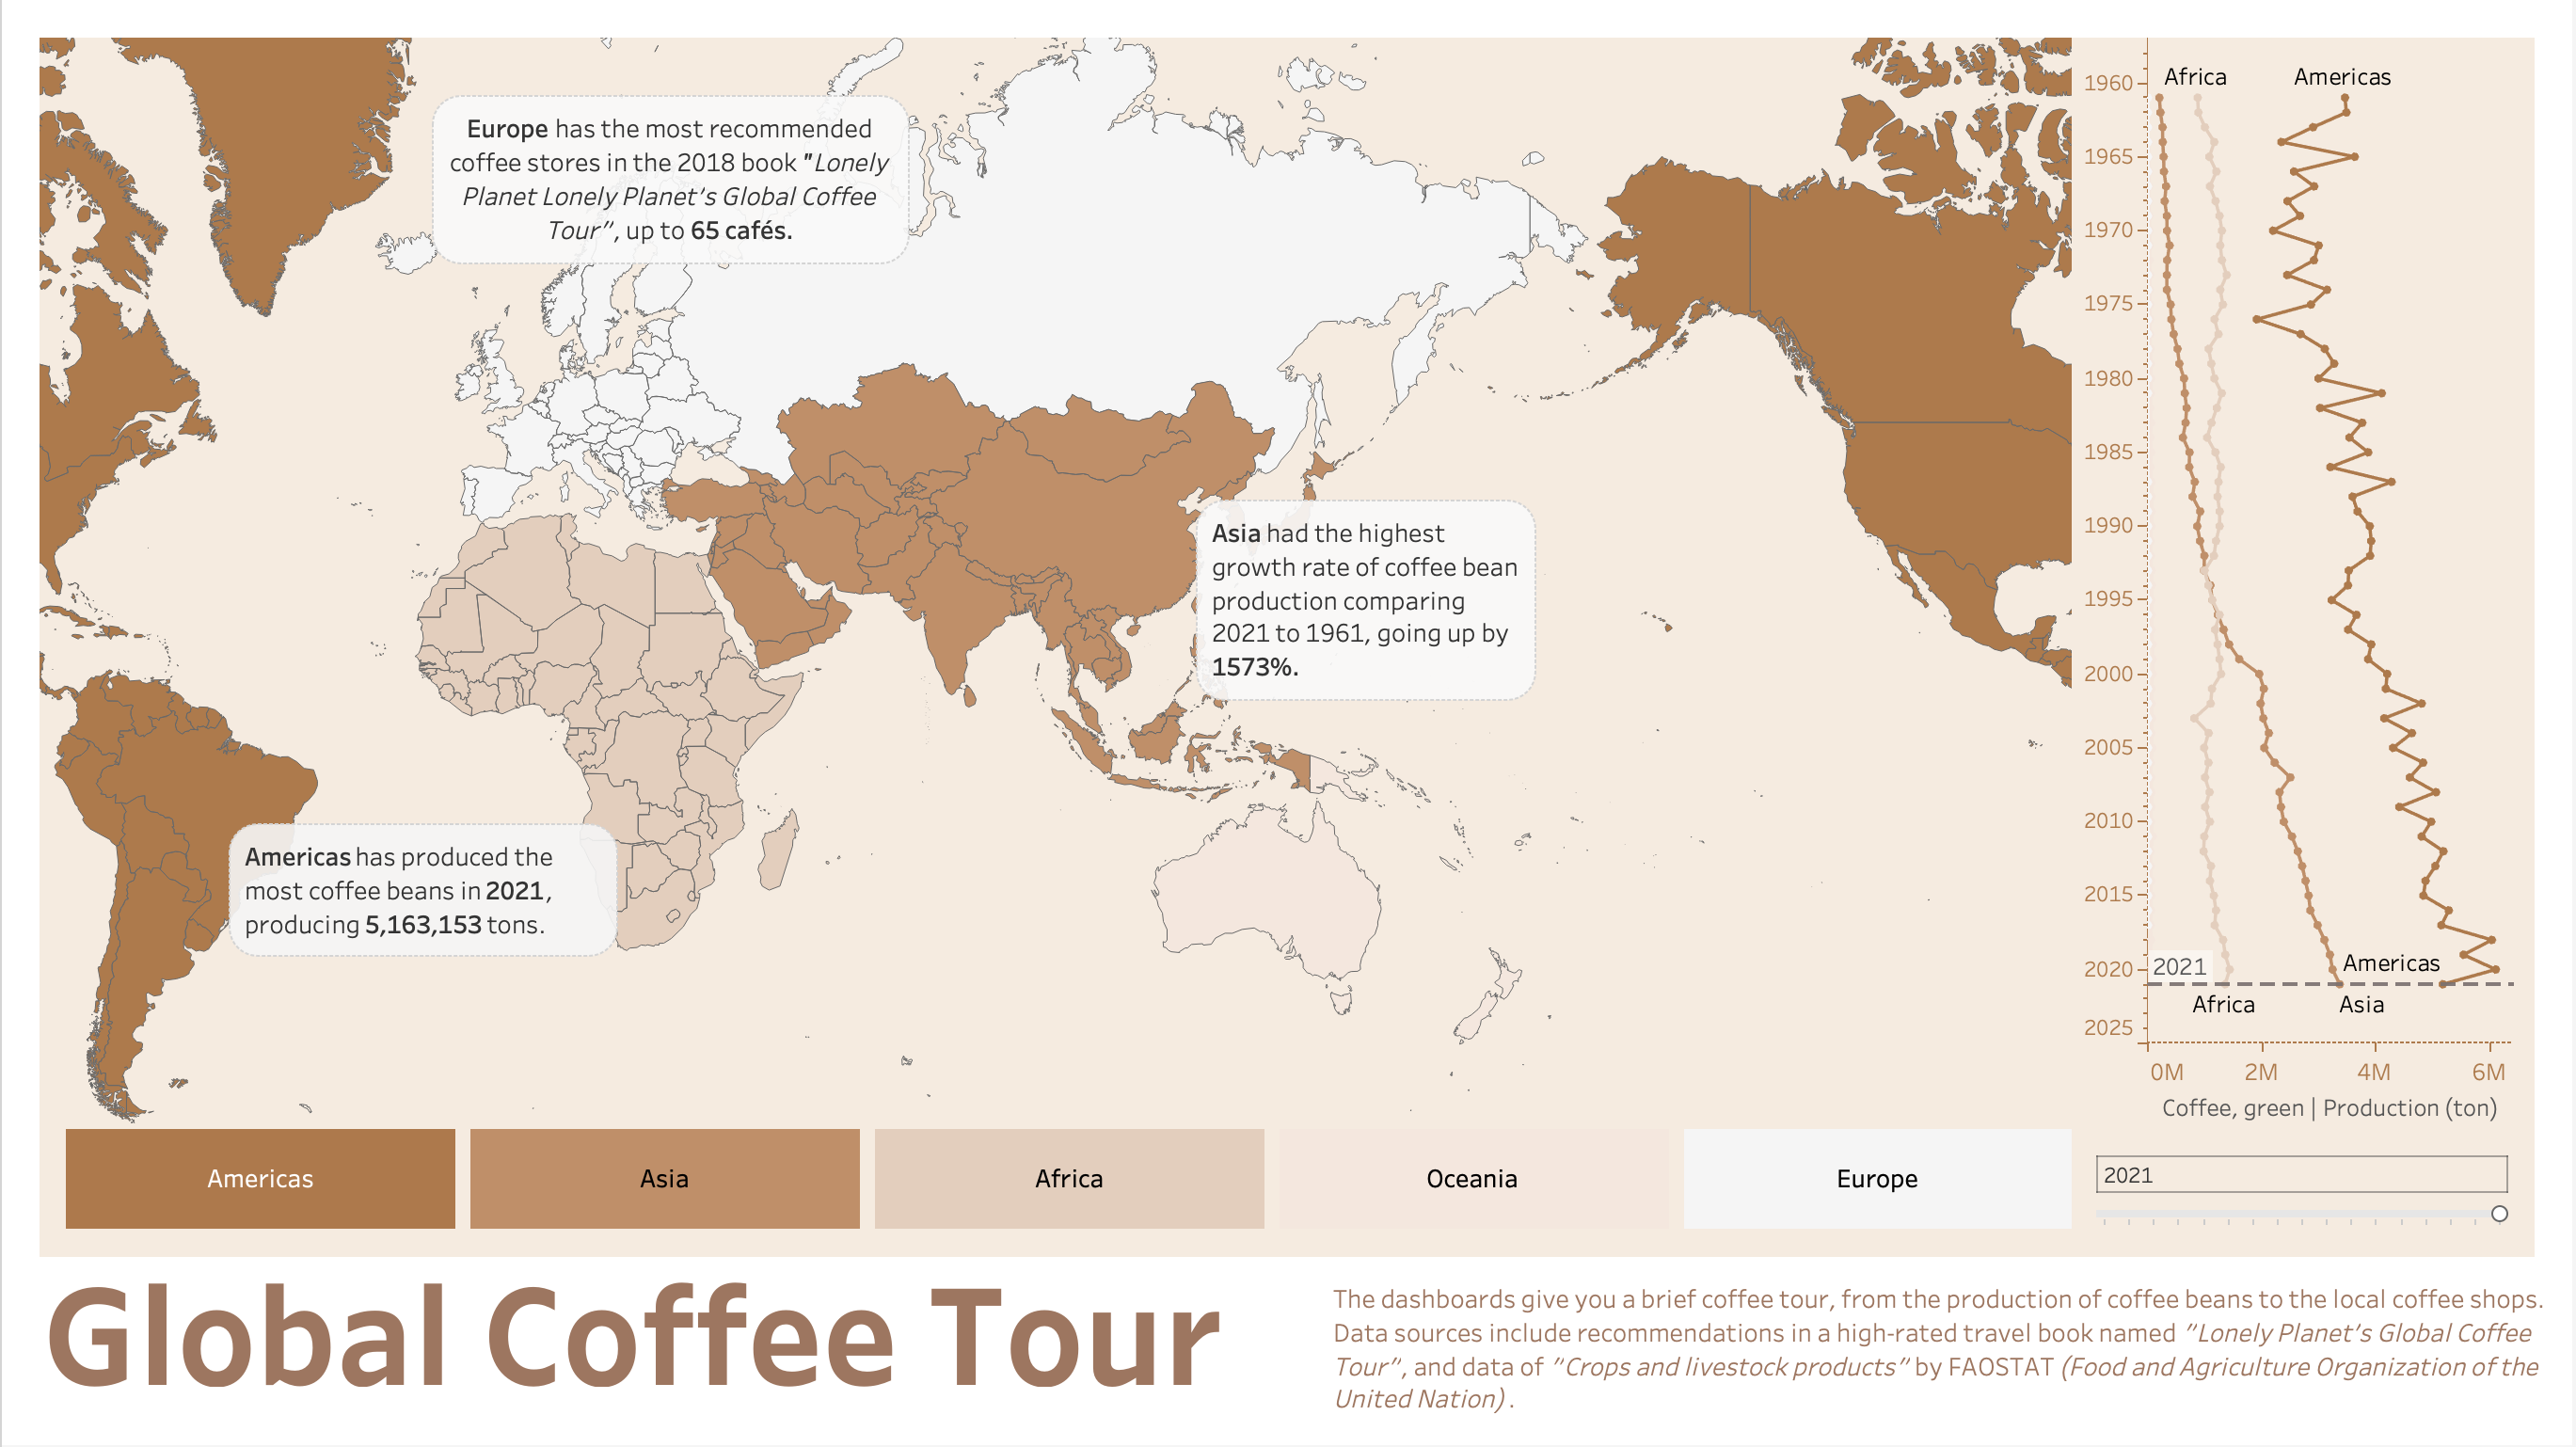
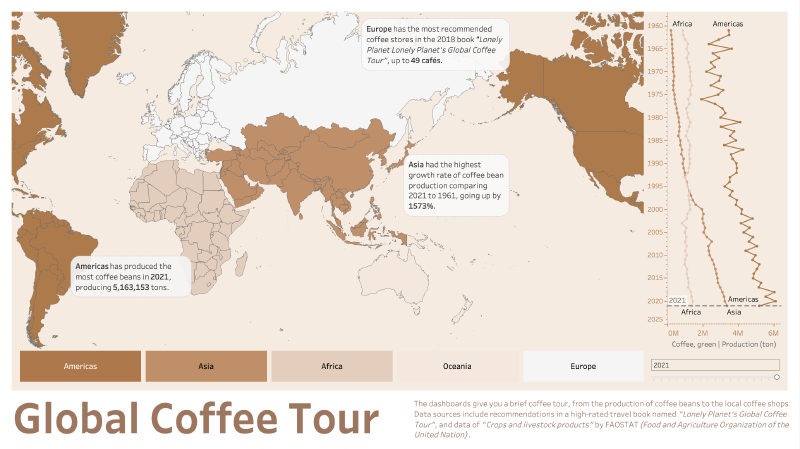
In Overview, production of coffee bean among 5 main continents is shown, with the time series analysis from 1961 to 2021. Among the continents,
- Europe has the most recommended coffee stores in the 2018 book “Lonely Planet Lonely Planet’s Global Coffee Tour”, up to 65 cafés.
- Asia had the highest growth rate of coffee bean production comparing 2021 to 1961, going up by 1573%.
- North and South America has produced the most coffee beans in 2021, producing 5,163,153 tons.
Data sources include recommendations in a high-rated travel book named “Lonely Planet’s Global Coffee Tour” (data collection in Google sheet clicks here), and data of “Crops and livestock products” by FAOSTAT (Food and Agriculture Organization of the United Nation).
Next 5 pages are showing countries in each continent and their signature coffee culture and stores. Click the country on the map or choose one in the filter, you could get a sense of its signature coffee style, coffee pairings, coffee language and do & don’ts. Find the best store with the highest ratings in the country you wanna tour in.
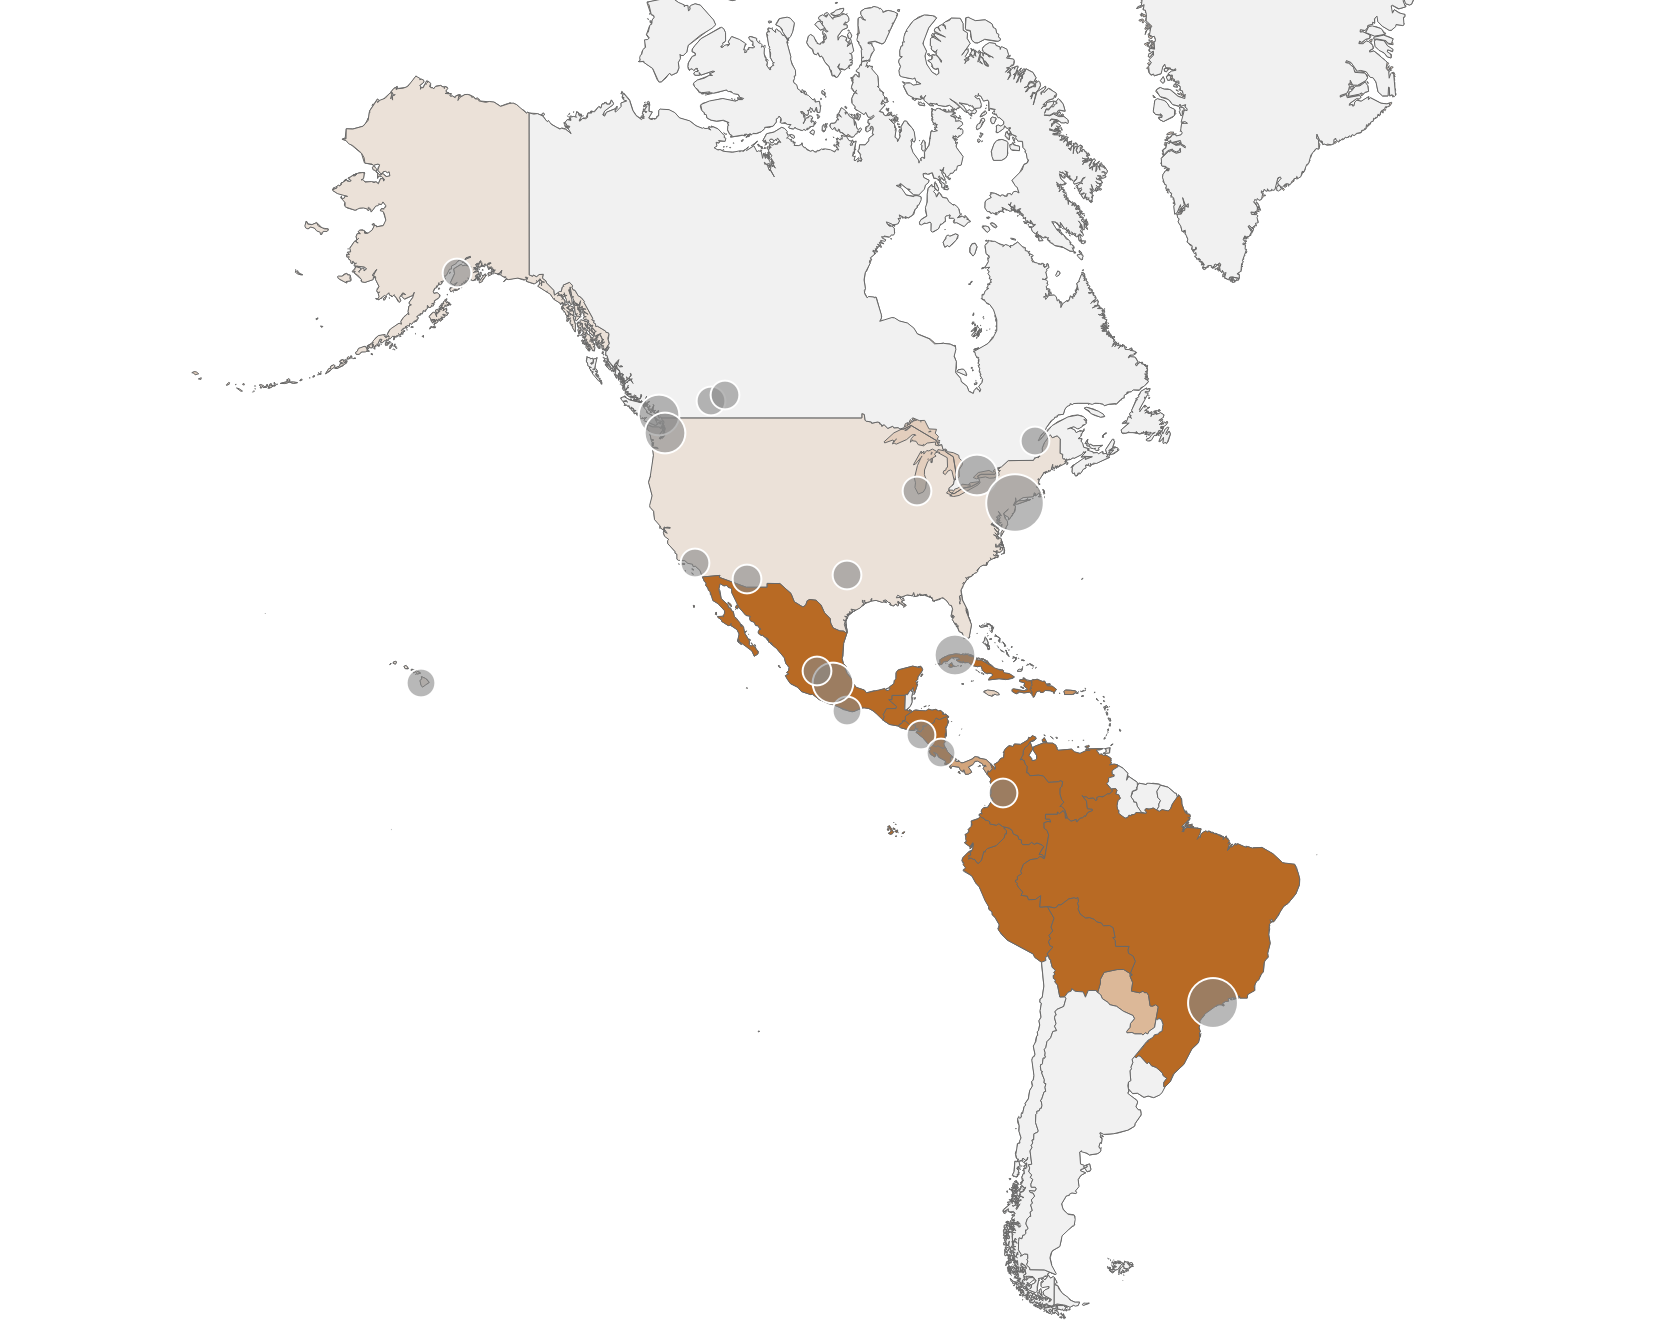
# Americas
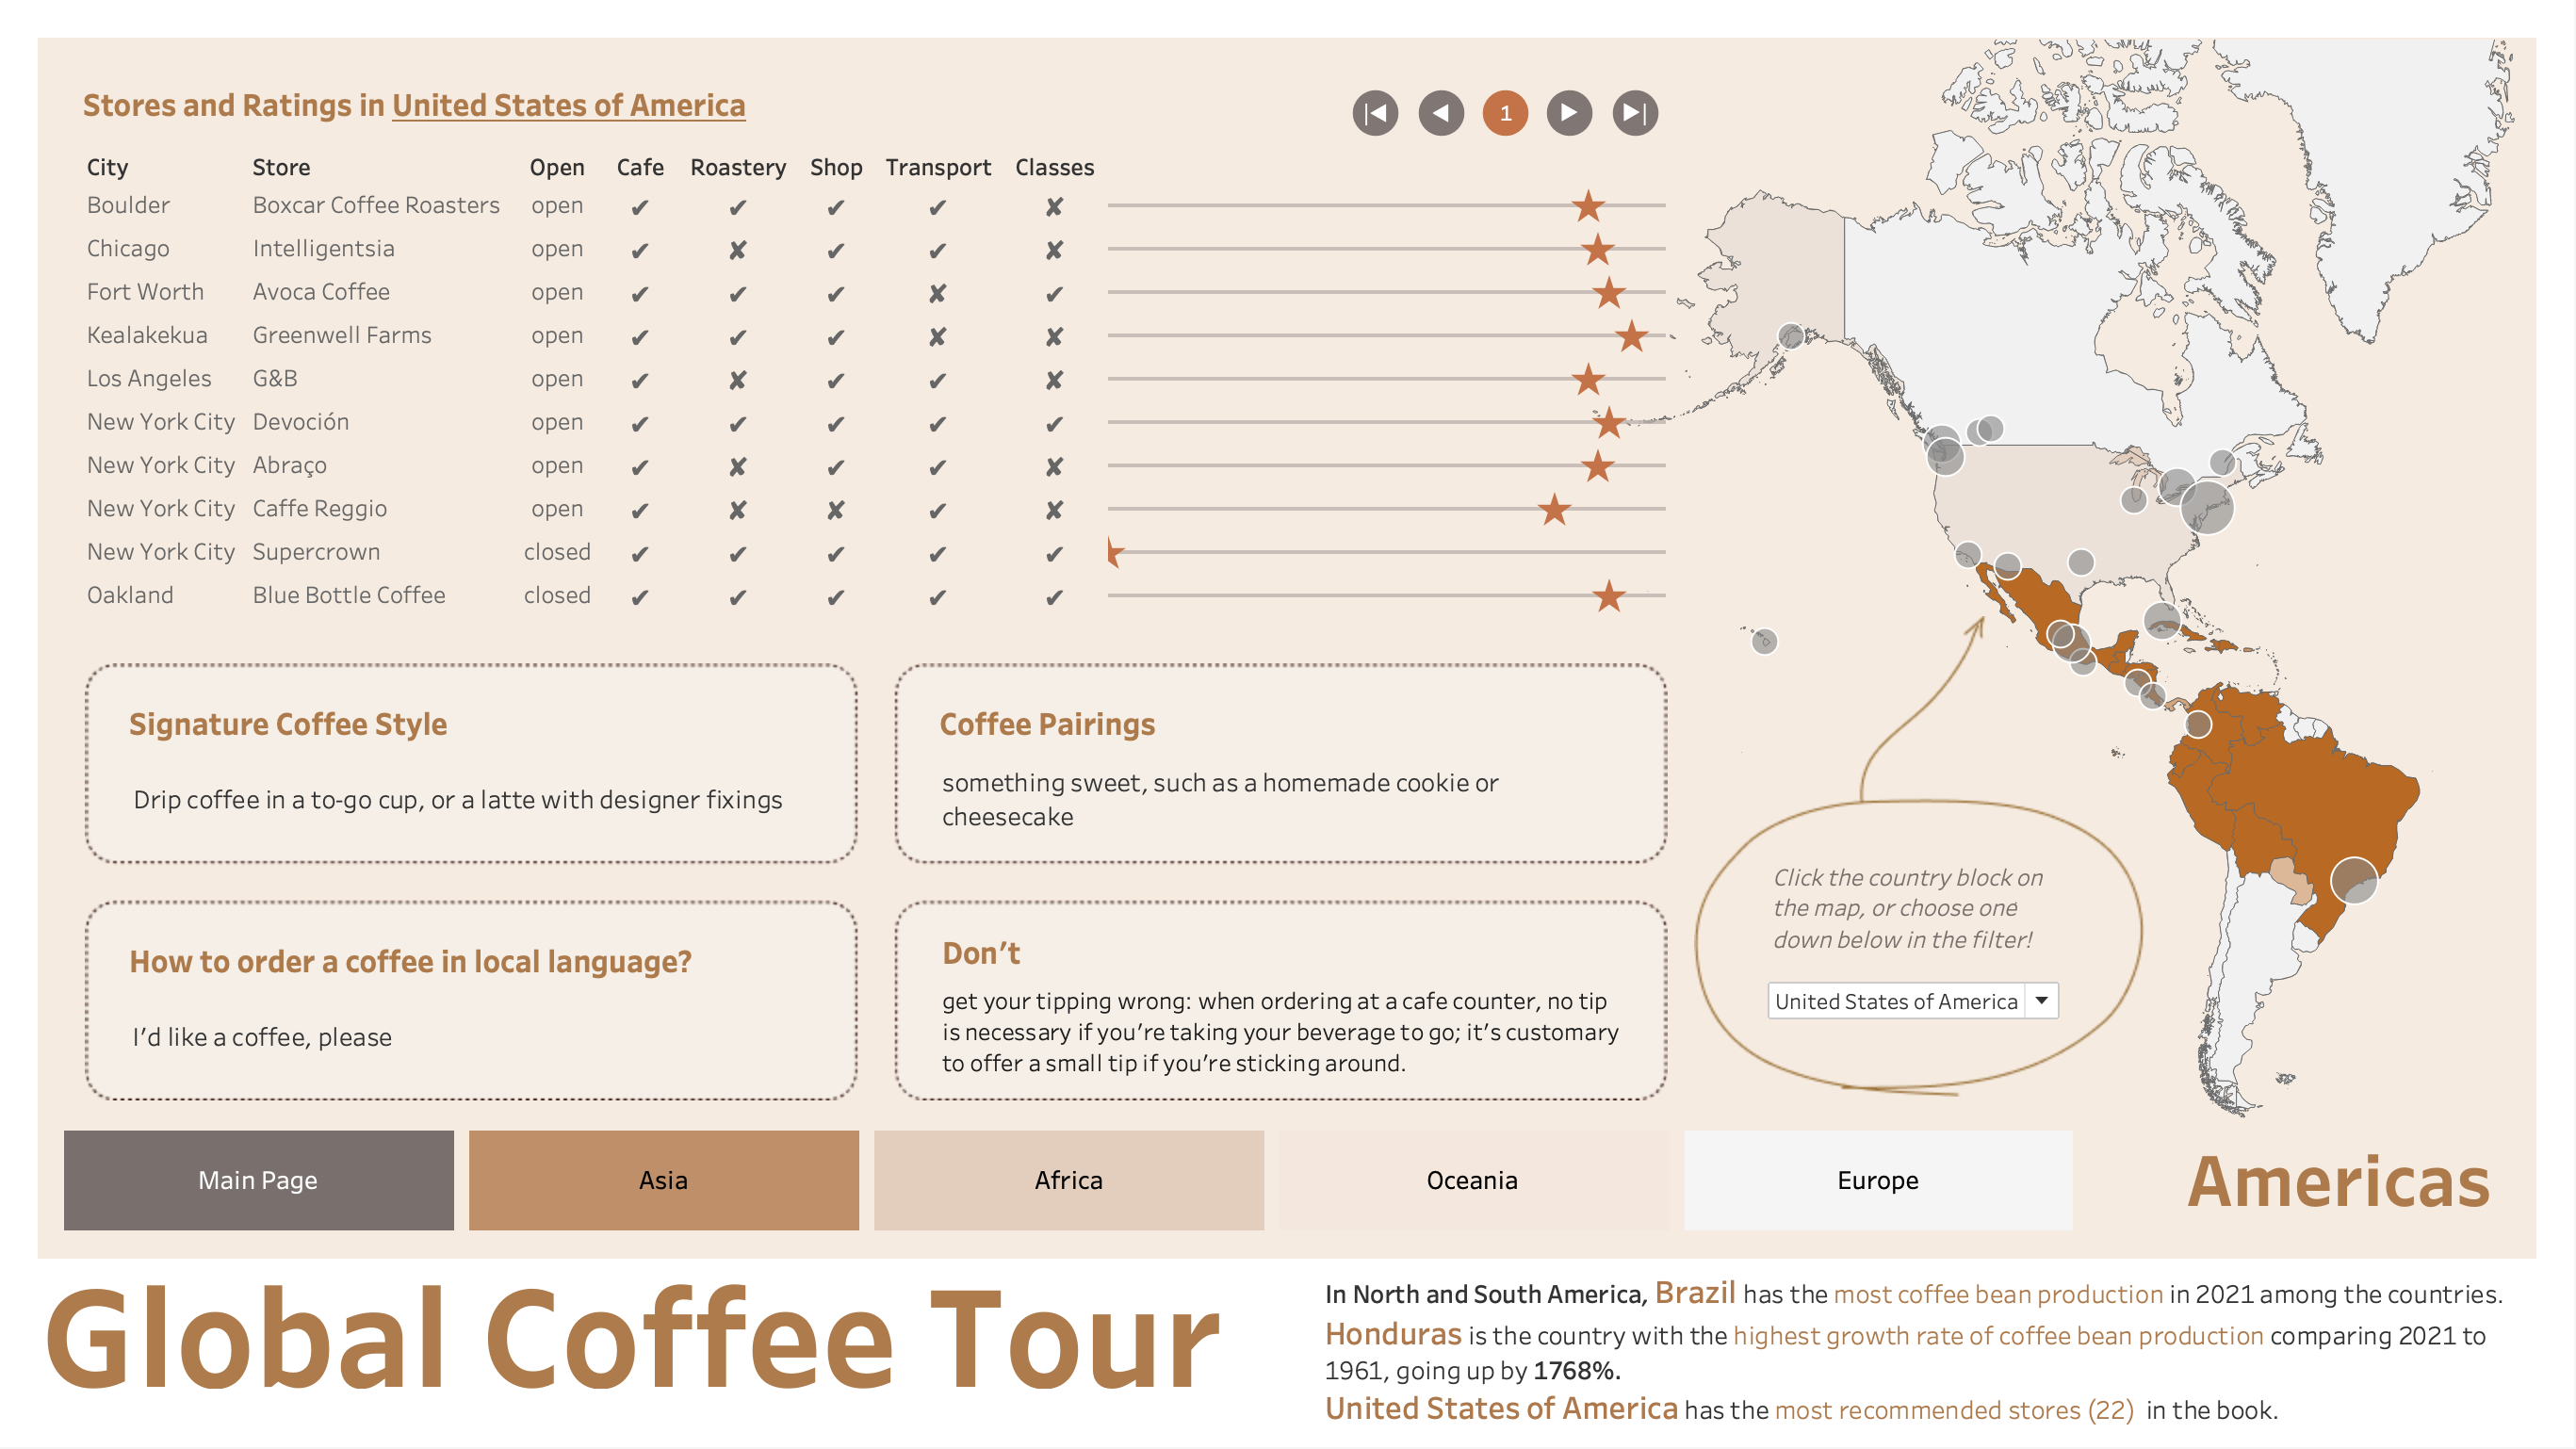
In North and South America,
- Brazil has the most coffee bean production in 2021 among the countries.
- Honduras is the country with the highest growth rate of coffee bean production comparing 2021 to 1961, going up by 1768%.
- United States of America has the most recommended stores (22) in the book.
# Africa
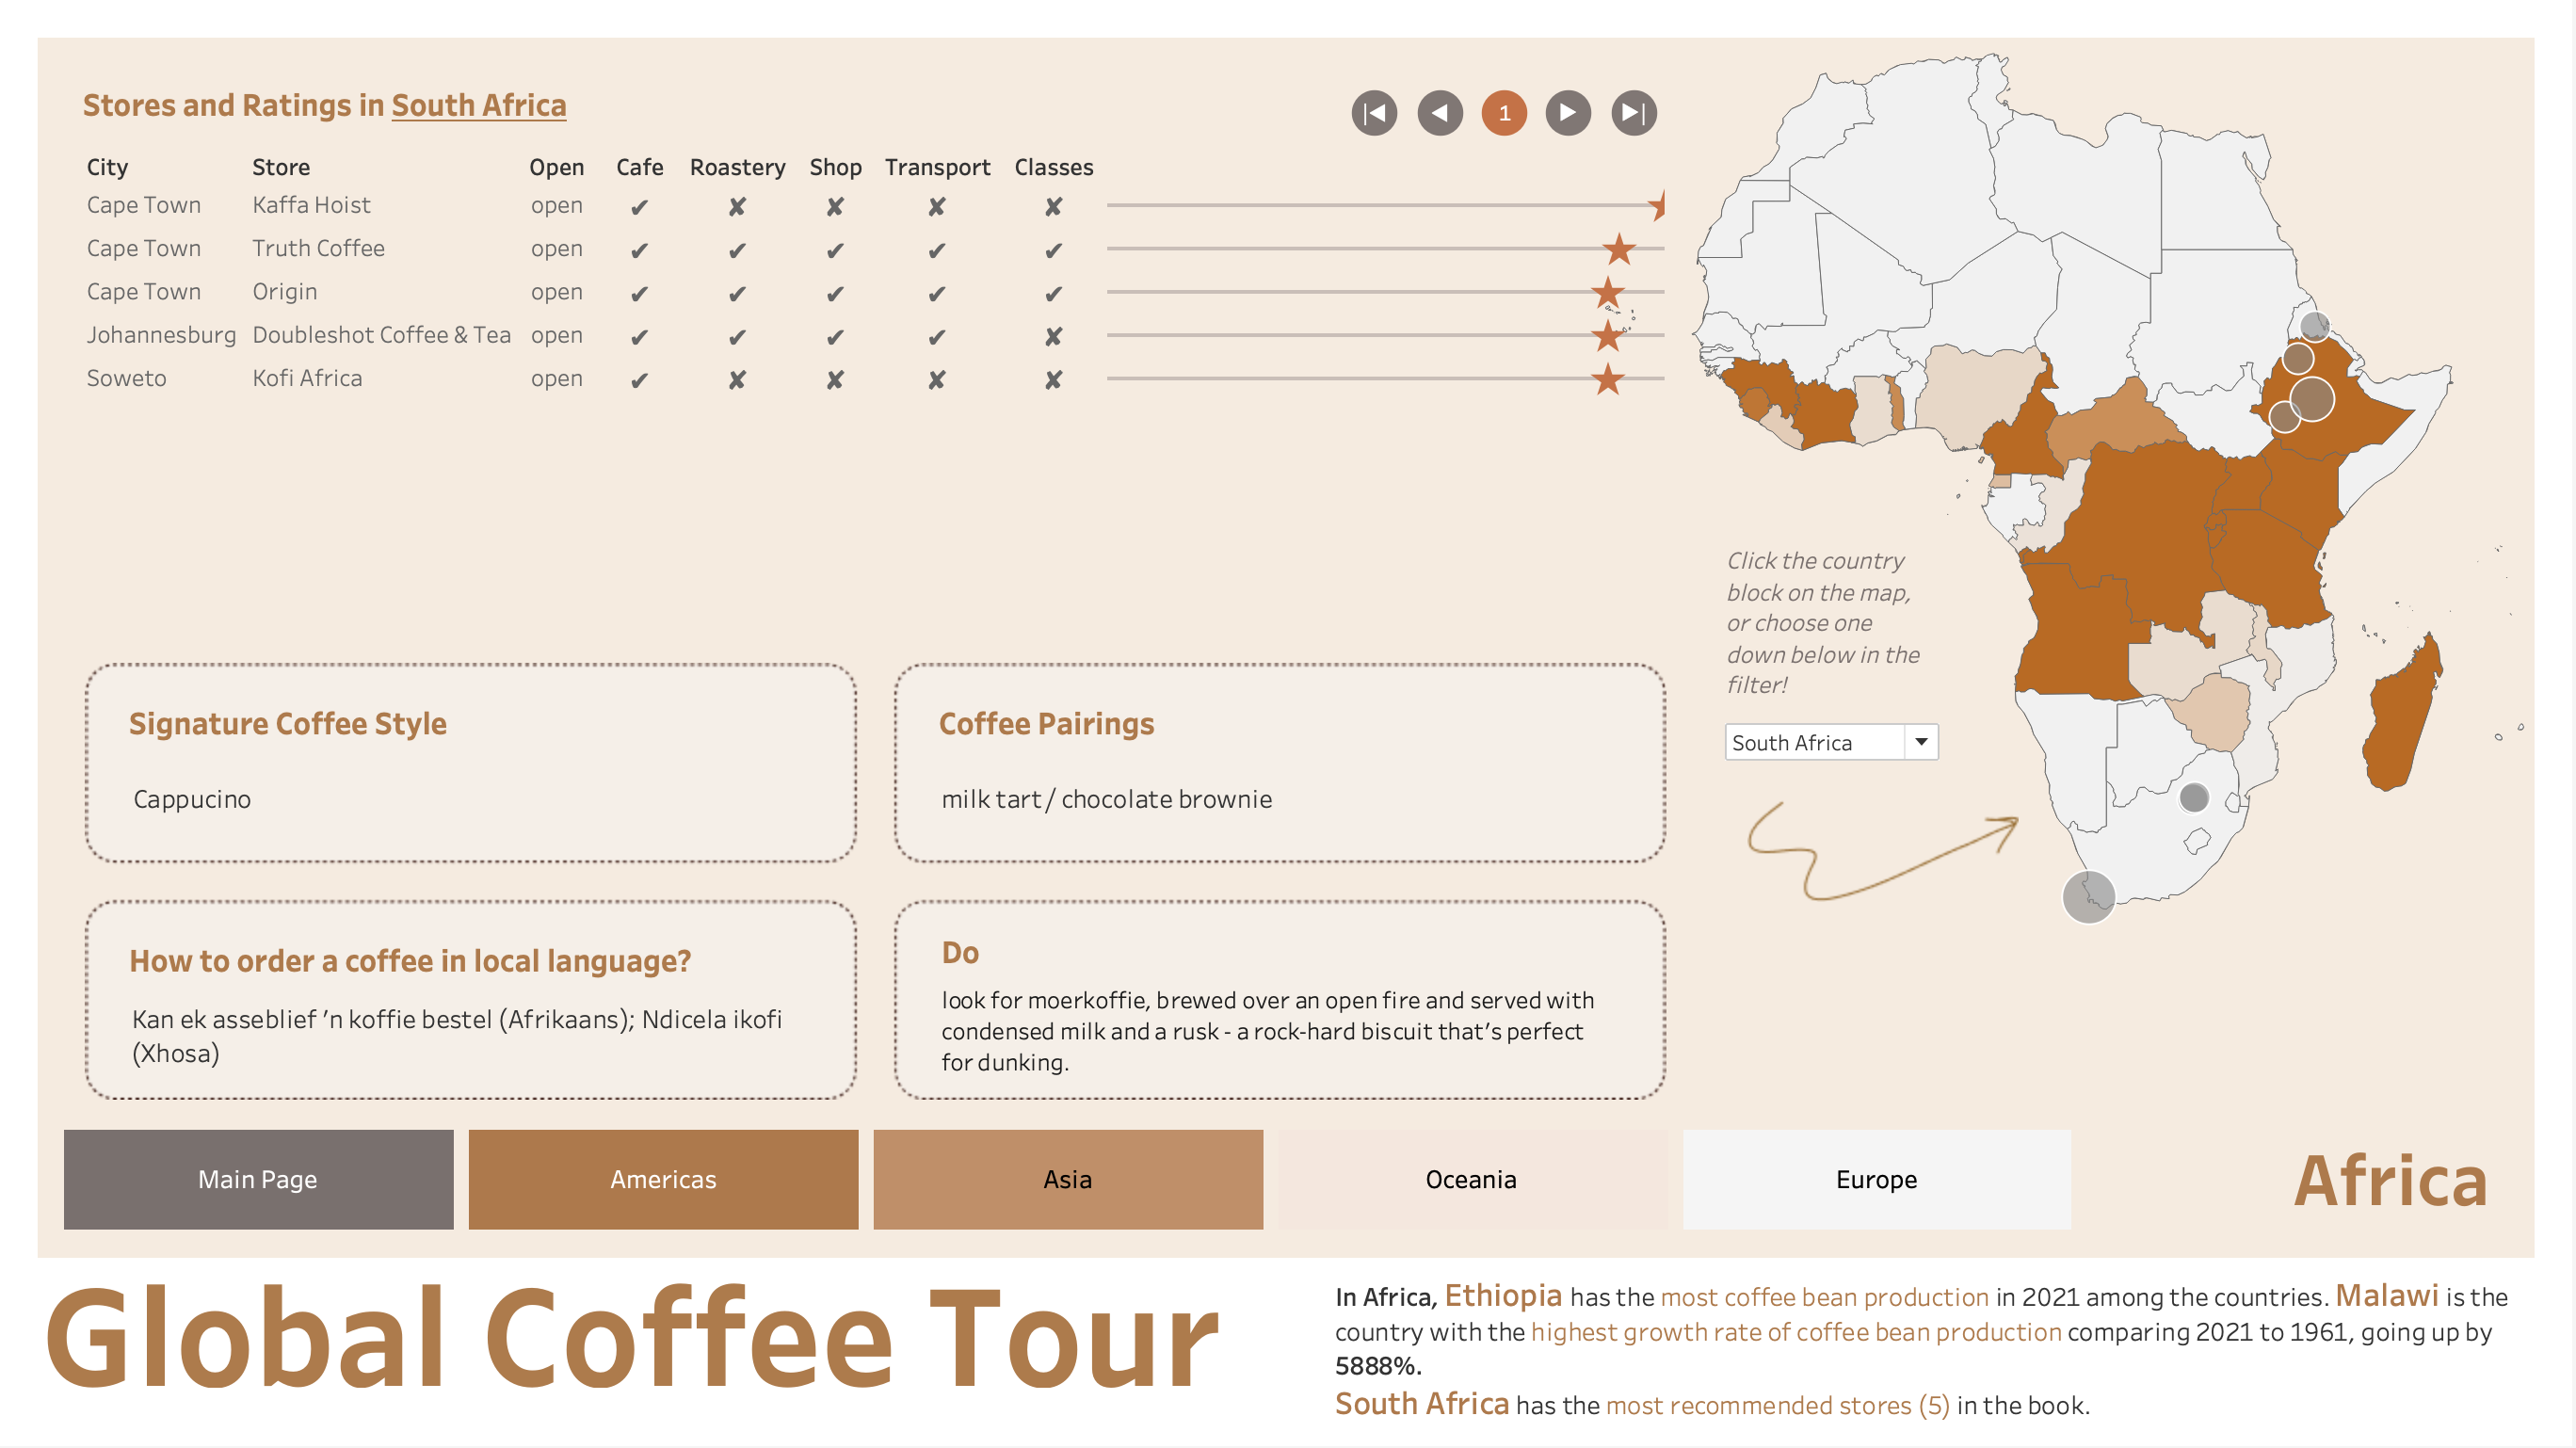
In Africa,
- Ethiopia has the most coffee bean production in 2021 among the countries.
- Malawi is the country with the highest growth rate of coffee bean production comparing 2021 to 1961, going up by 5888%.
- South Africa has the most recommended stores (5) in the book.
# Asia
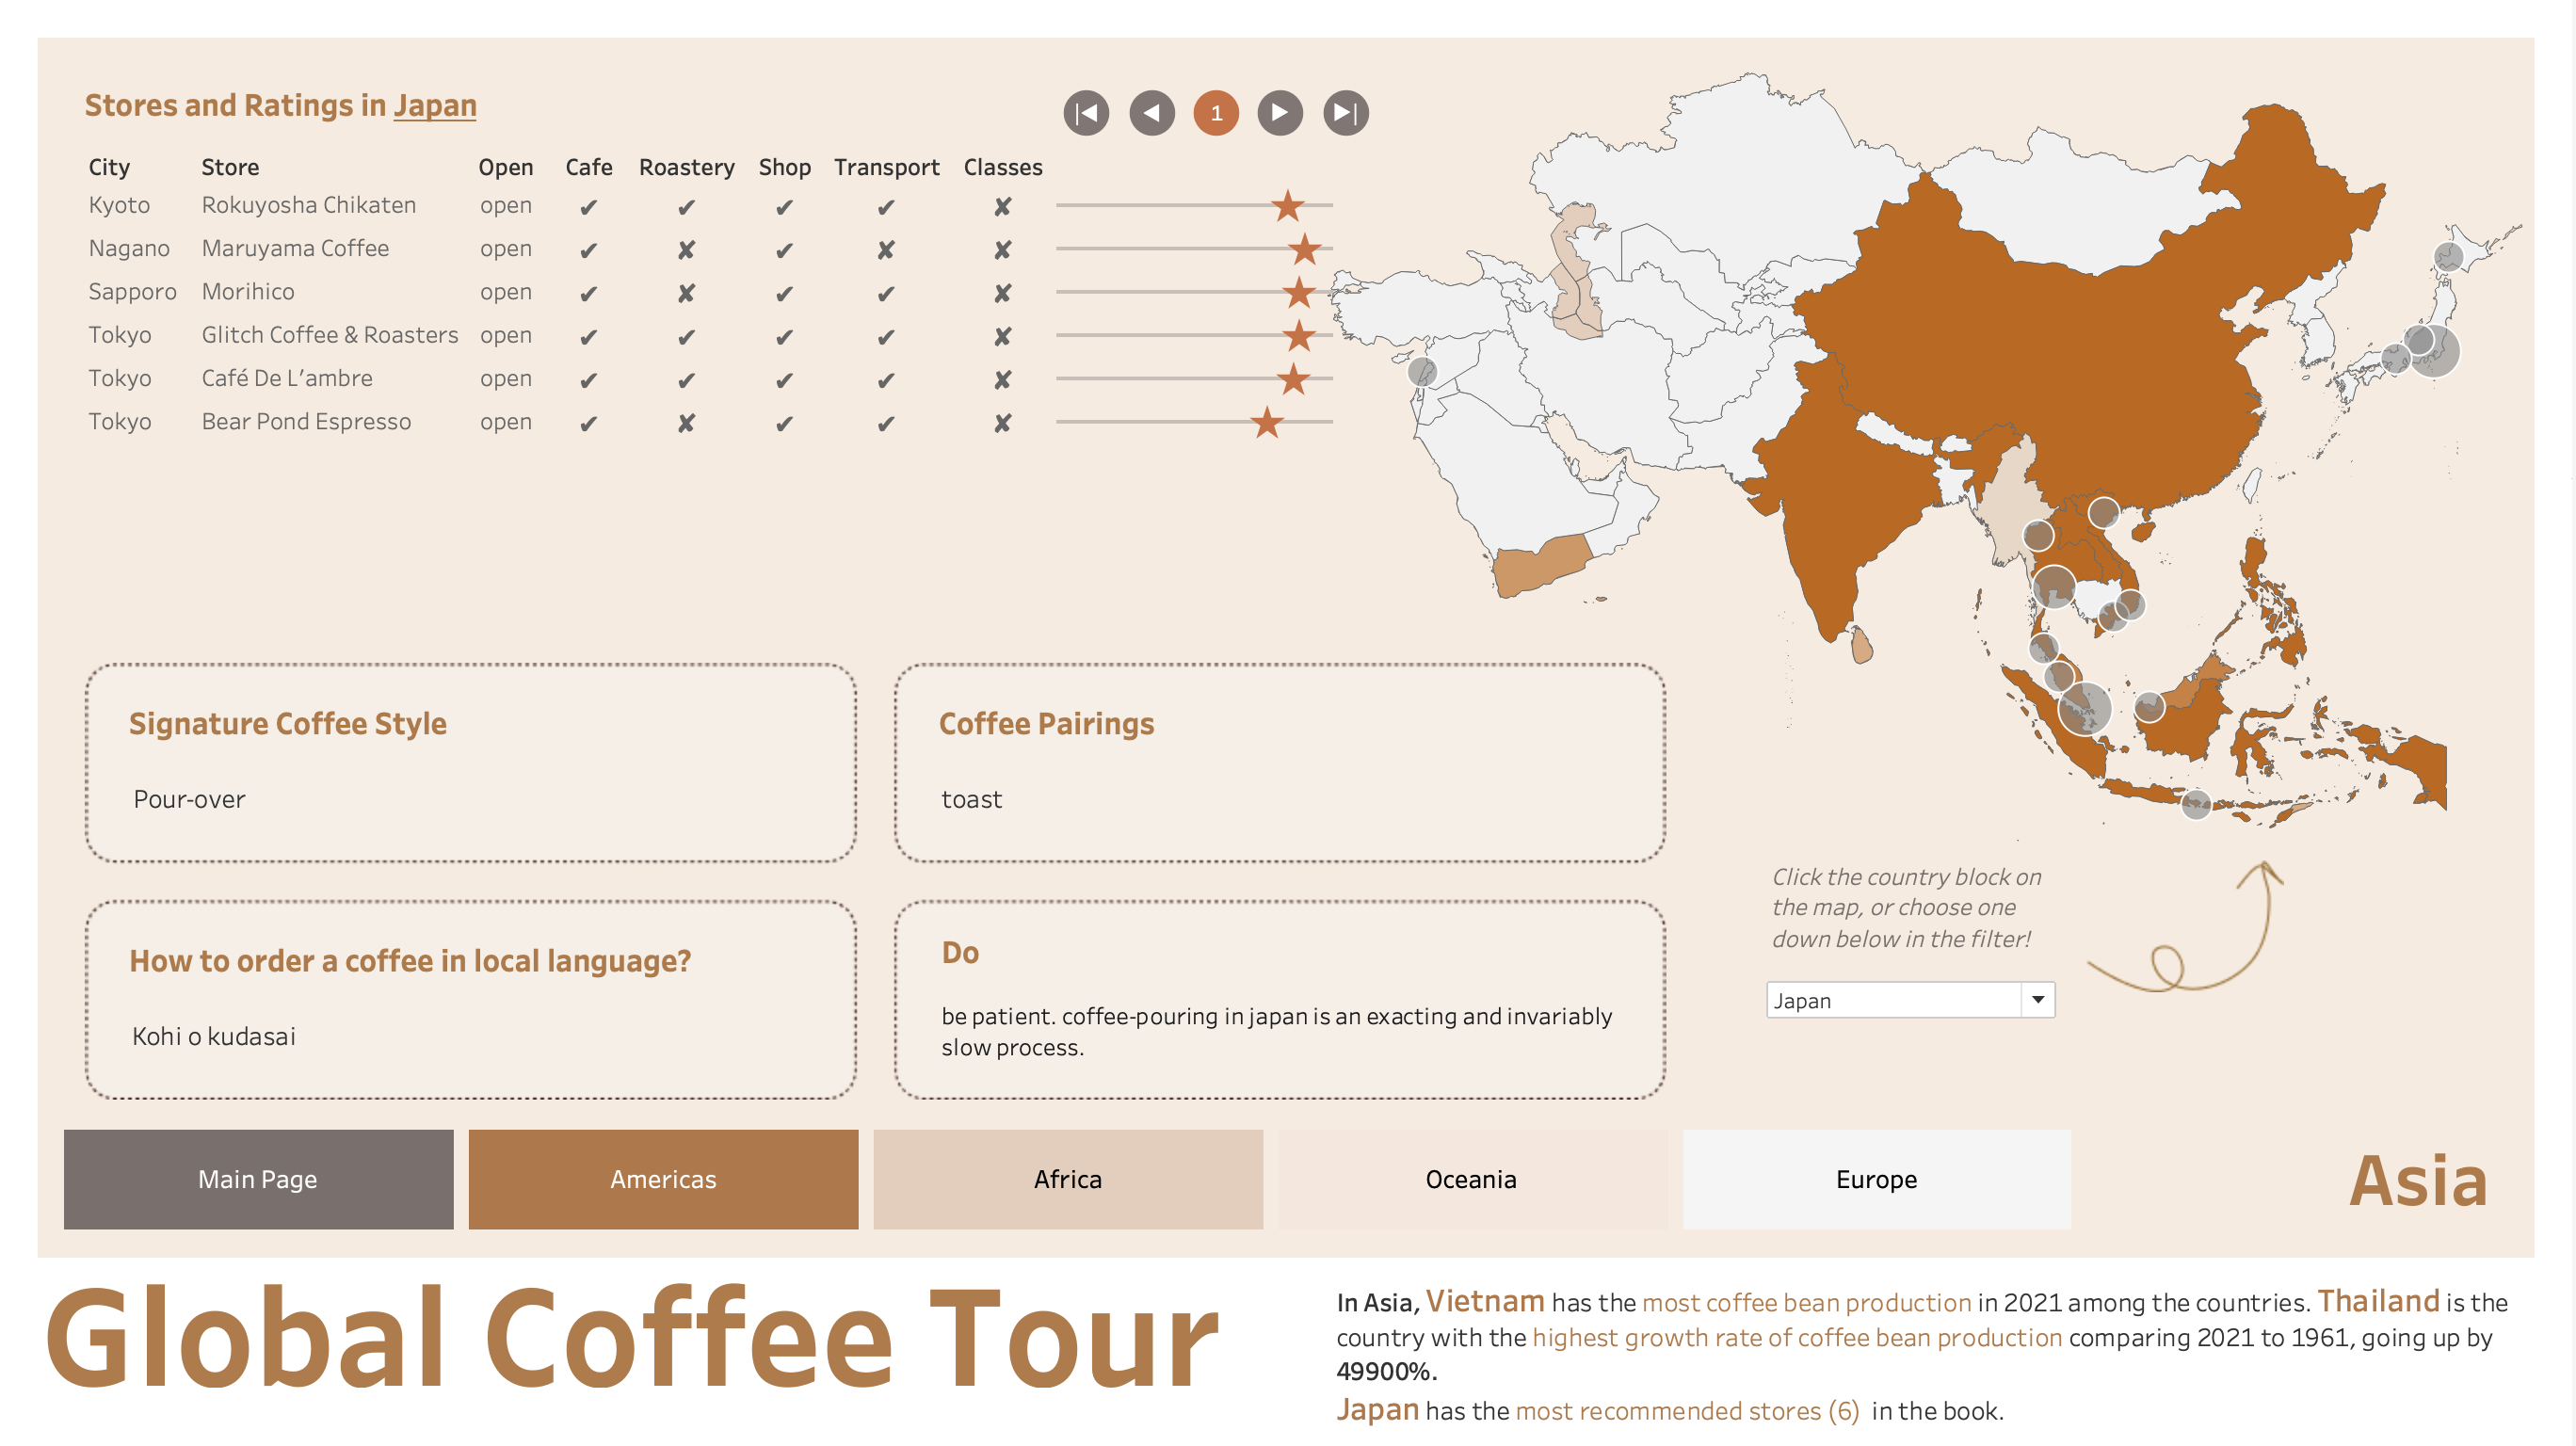
In Asia,
- Vietnam has the most coffee bean production in 2021 among the countries.
- Thailand is the country with the highest growth rate of coffee bean production comparing 2021 to 1961, going up by 49900%.
- Japan has the most recommended stores (6) in the book.
# Oceania
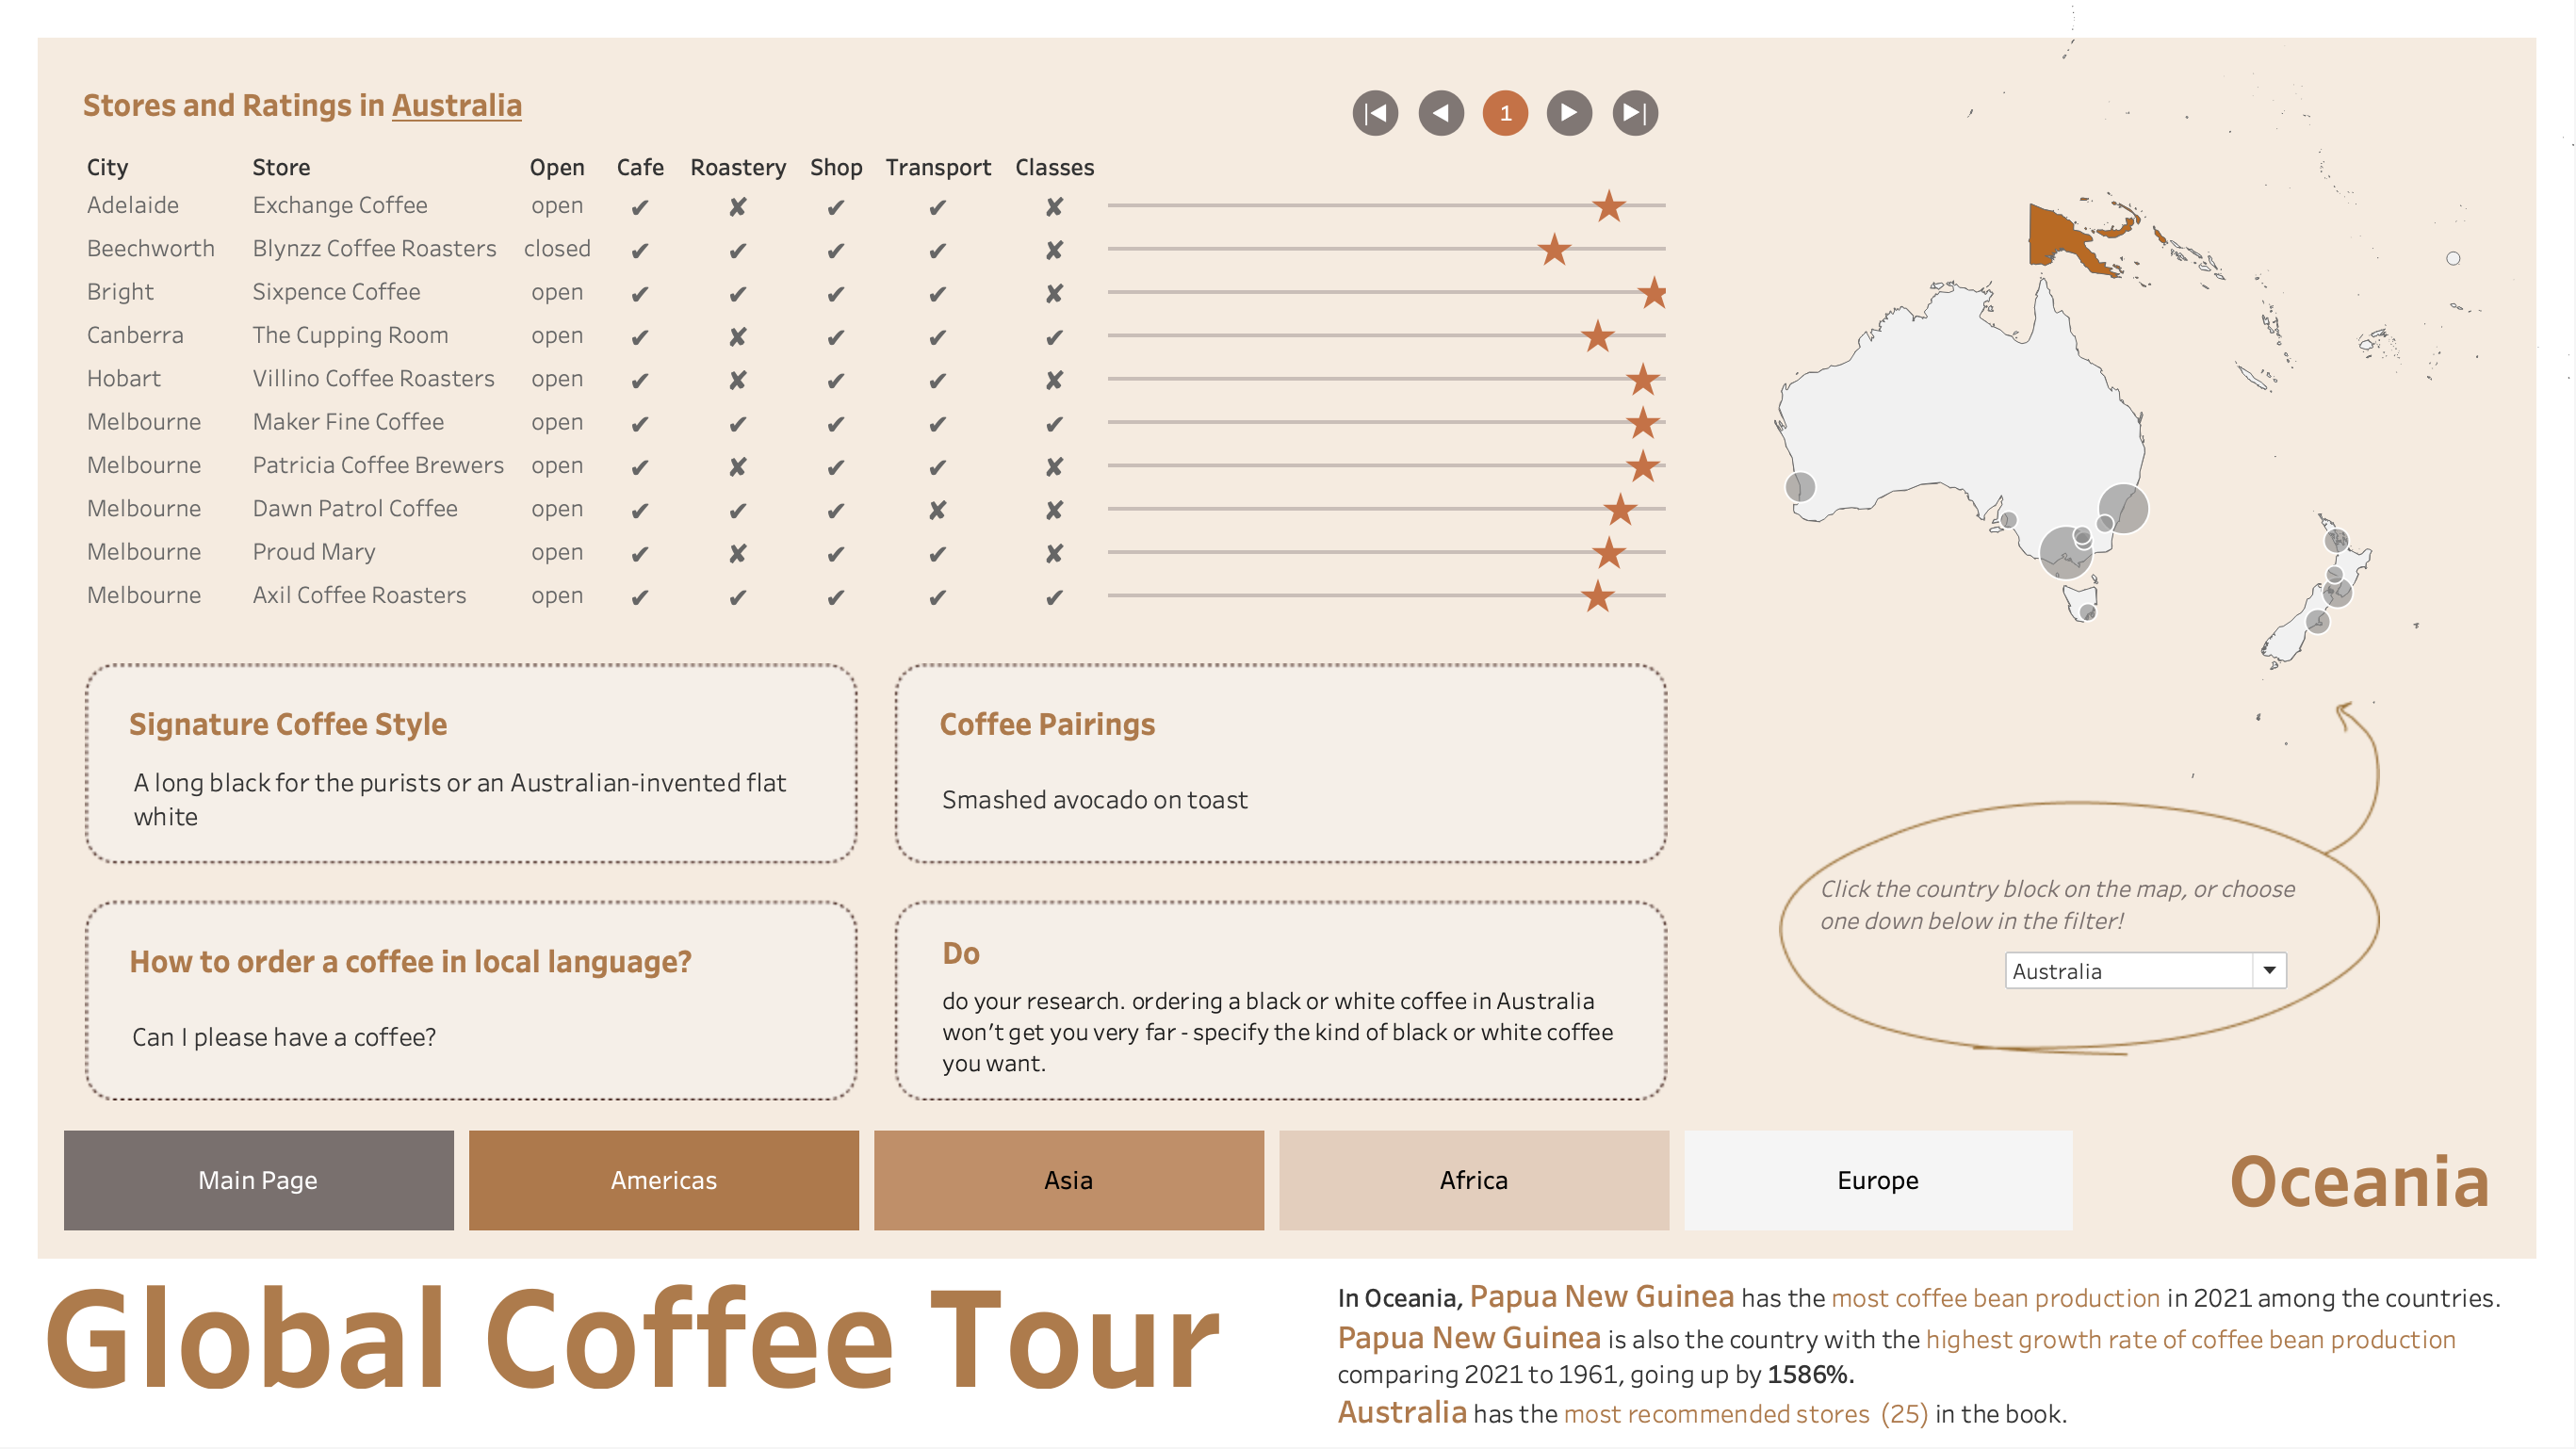
In Oceania,
- Papua New Guinea has the most coffee bean production in 2021 among the countries.
- Papua New Guinea is also the country with the highest growth rate of coffee bean production comparing 2021 to 1961, going up by 1586%.
- Australia has the most recommended stores (25) in the book.
# Europe
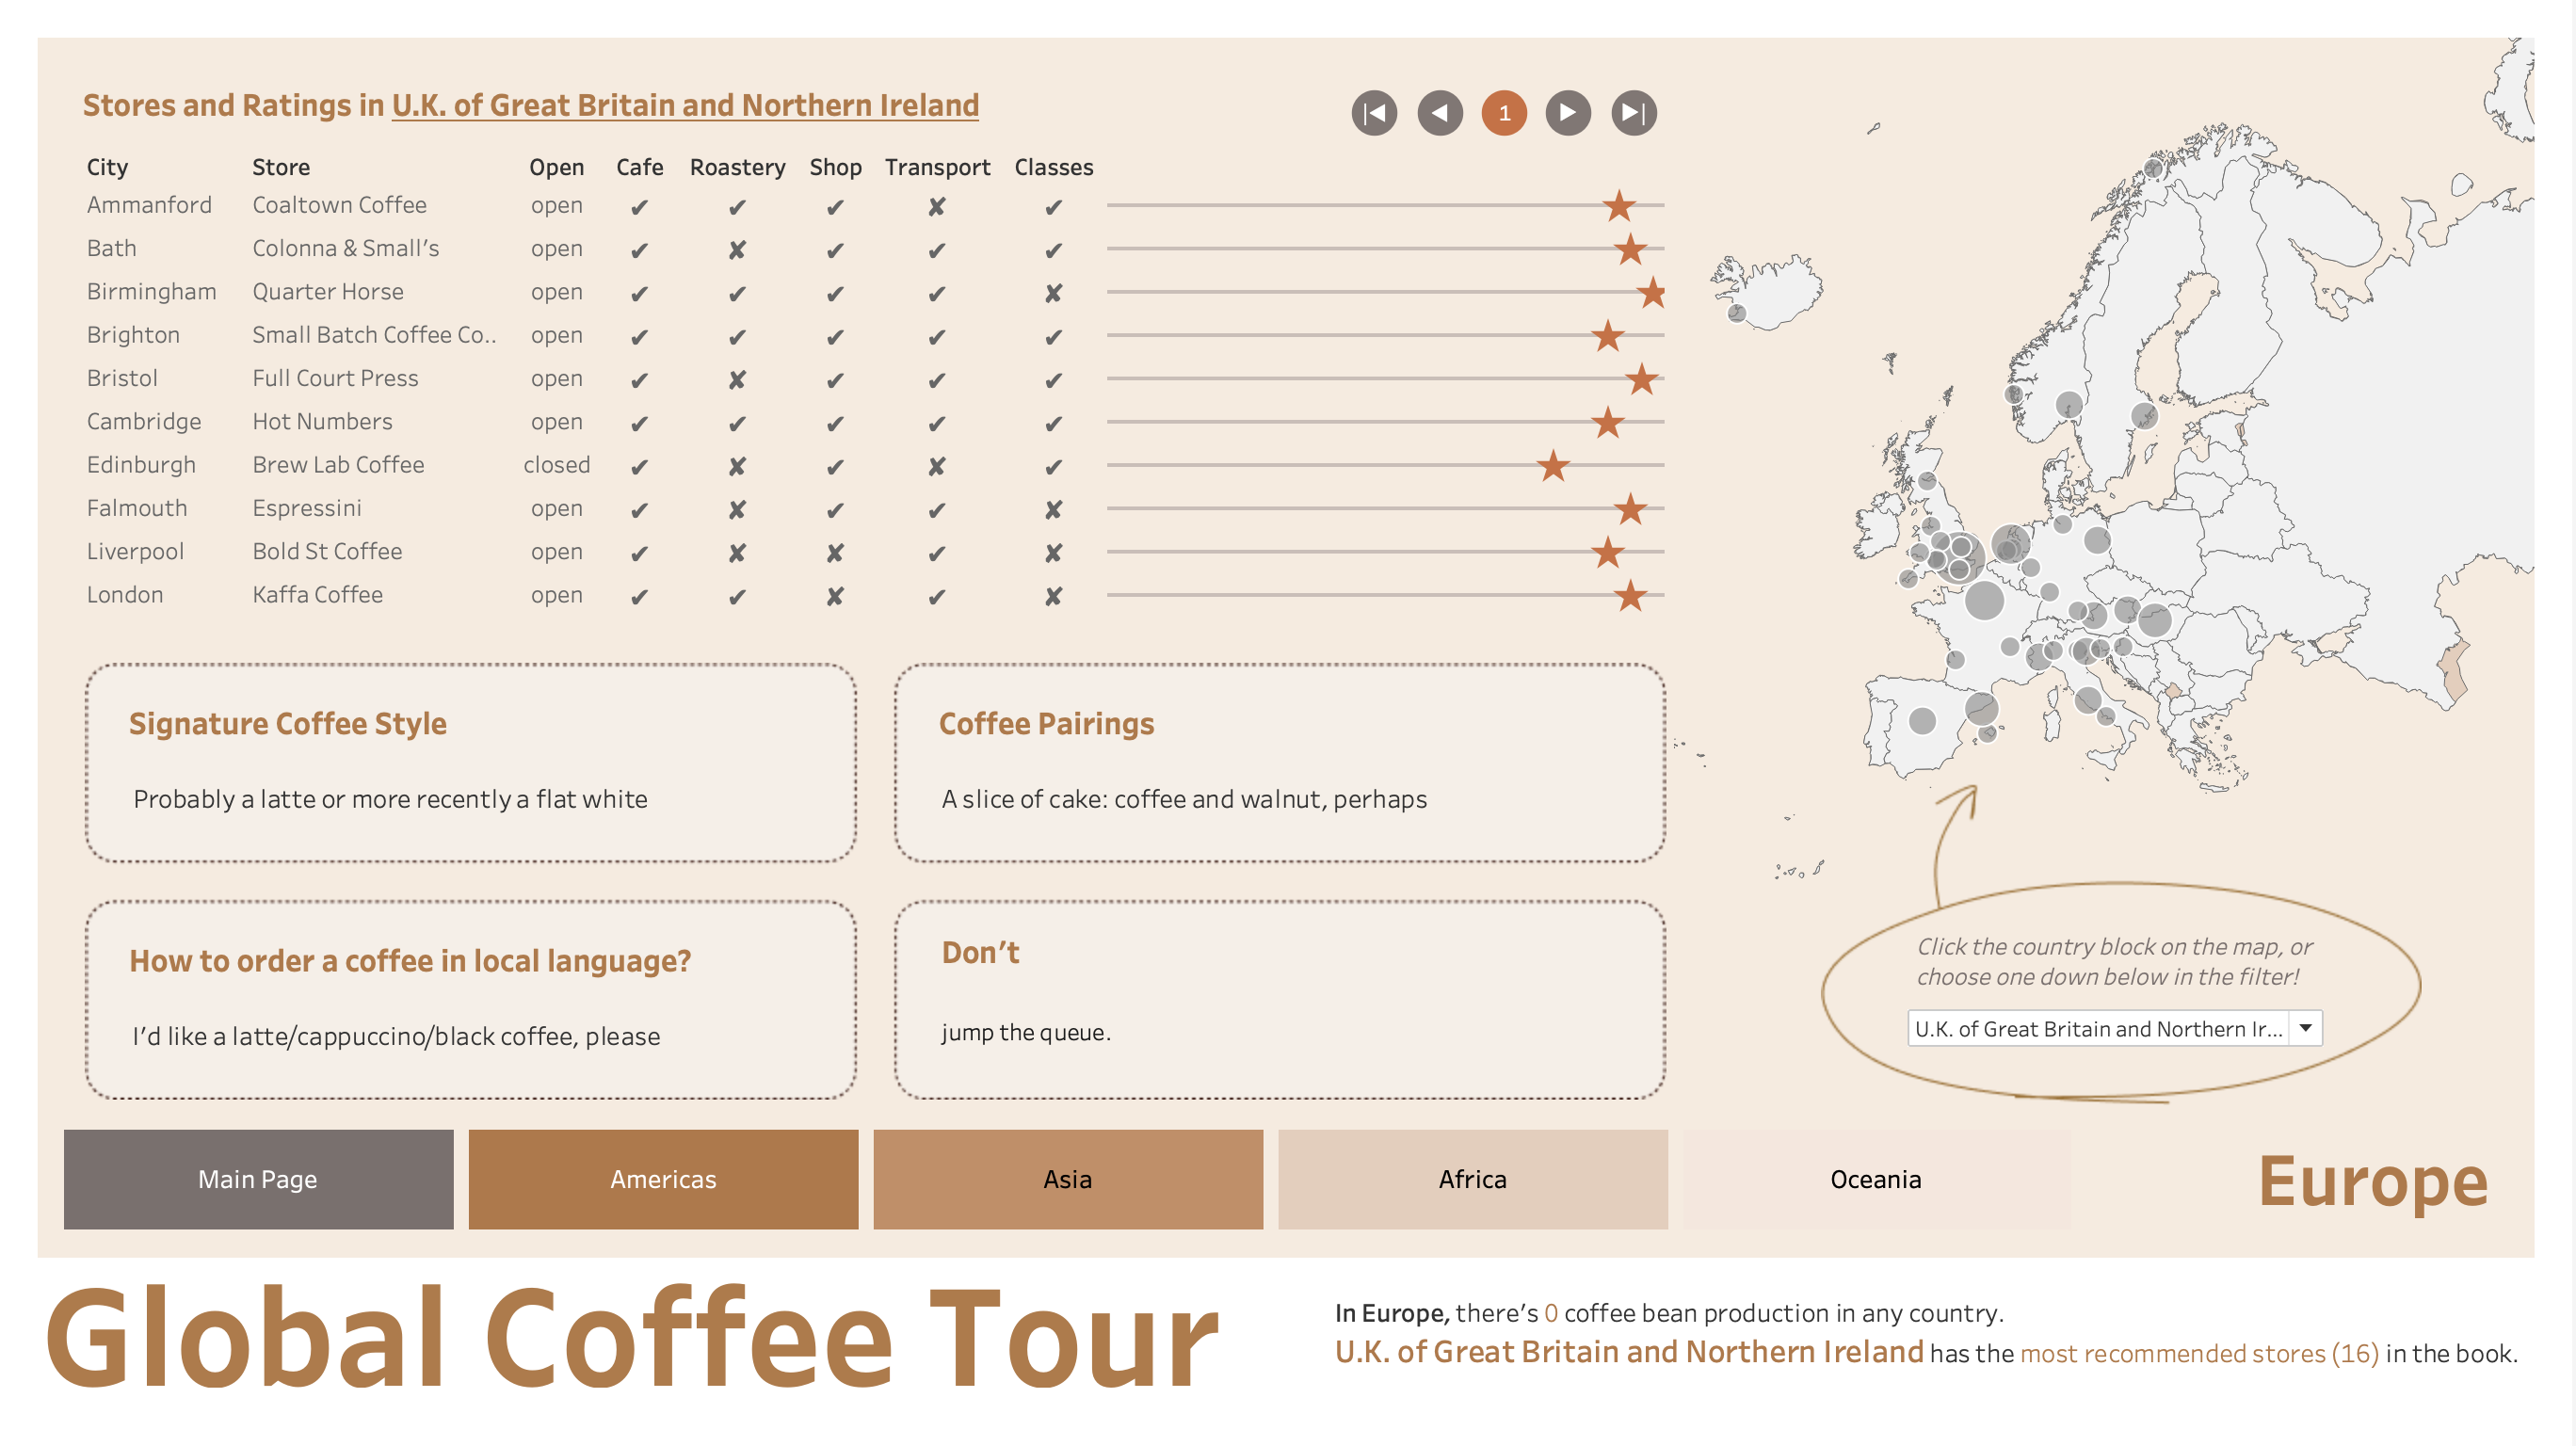
In Europe,
- there’s 0 coffee bean production in any country.
- U.K. of Great Britain and Northern Ireland has the most recommended stores (16) in the book.
# Brainstorming ideas
In March, 2024, I made it one of my new year resolutions to make at least 10 complete personal projects. I was a data operations specialist, or technically a business analyst. The daily work and ad hoc work involved a lot of data cleaning, since the company I was in was on the progress of building a ERP system but it’s still in the earliest stages. While I was wondering in a coffee shop about what other interesting topics I can dive in outside work, having the accessible data and playing around the data without social consequences, I said to myself, why not coffee since I’m a coffee lover?
Since then I browsed through websites and books, searched for data about coffee, ranging from coffee bean production, coffee types, coffee shops, and I came across a book named “Lonely Planet’s Global Coffee Tour”. It’s published in 2018, rated high on Amazon, and available in the local library. I borrowed it, read it, and collected information and self-made a table including unique coffee styles in 36 countries across 7 continents, provided services and ratings of 164 coffee shops around the world. (Google sheet link is here.)
Using this data as the main source, I was hoping to set up a simple coffee info & recommendation system.
# The way I did it and challenges along the way
# Tableau map limitations when drawing a single continent
What I had in mind is to show one continent at each dashboard, but Tableau doesn’t have continent attribute when it comes to draw maps. Good thing is ArcGIS provides shape files for each continent.
Next thing is to standardize the aliases. For example, in ArcGIS data, North America and South America, as the book mentioned, are both recorded as Americas. Before I put the data in Tableau, firstly I had to align them, so that the same thing has the same name in different data sources.
# Paginate the table in Tableau
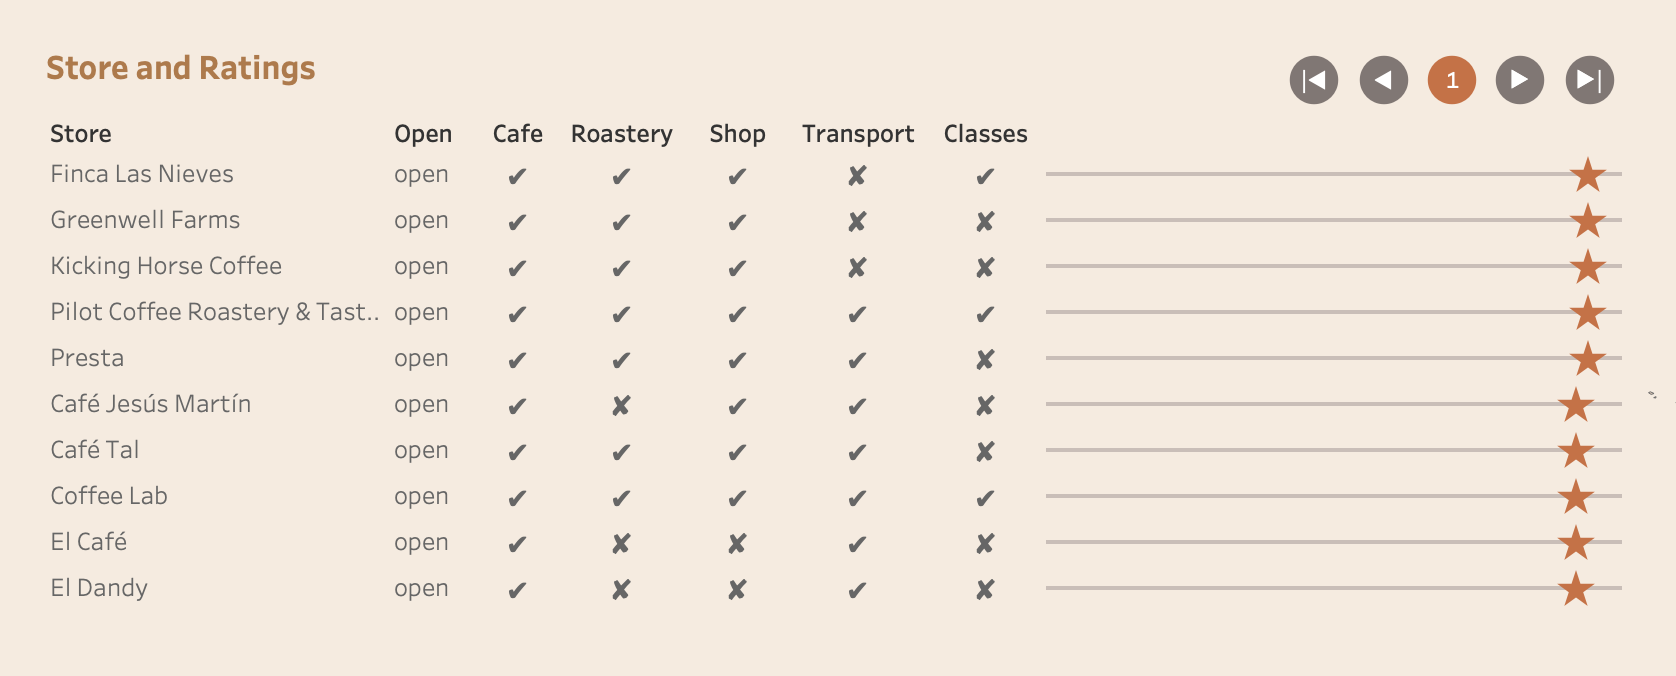
I collected the information of as many as 164 coffee shops from the book, which cannot be shown in a table at the same time without scrolling your mouse. So what I had in mind is a next/previous button to replace the page scroller, something like this:

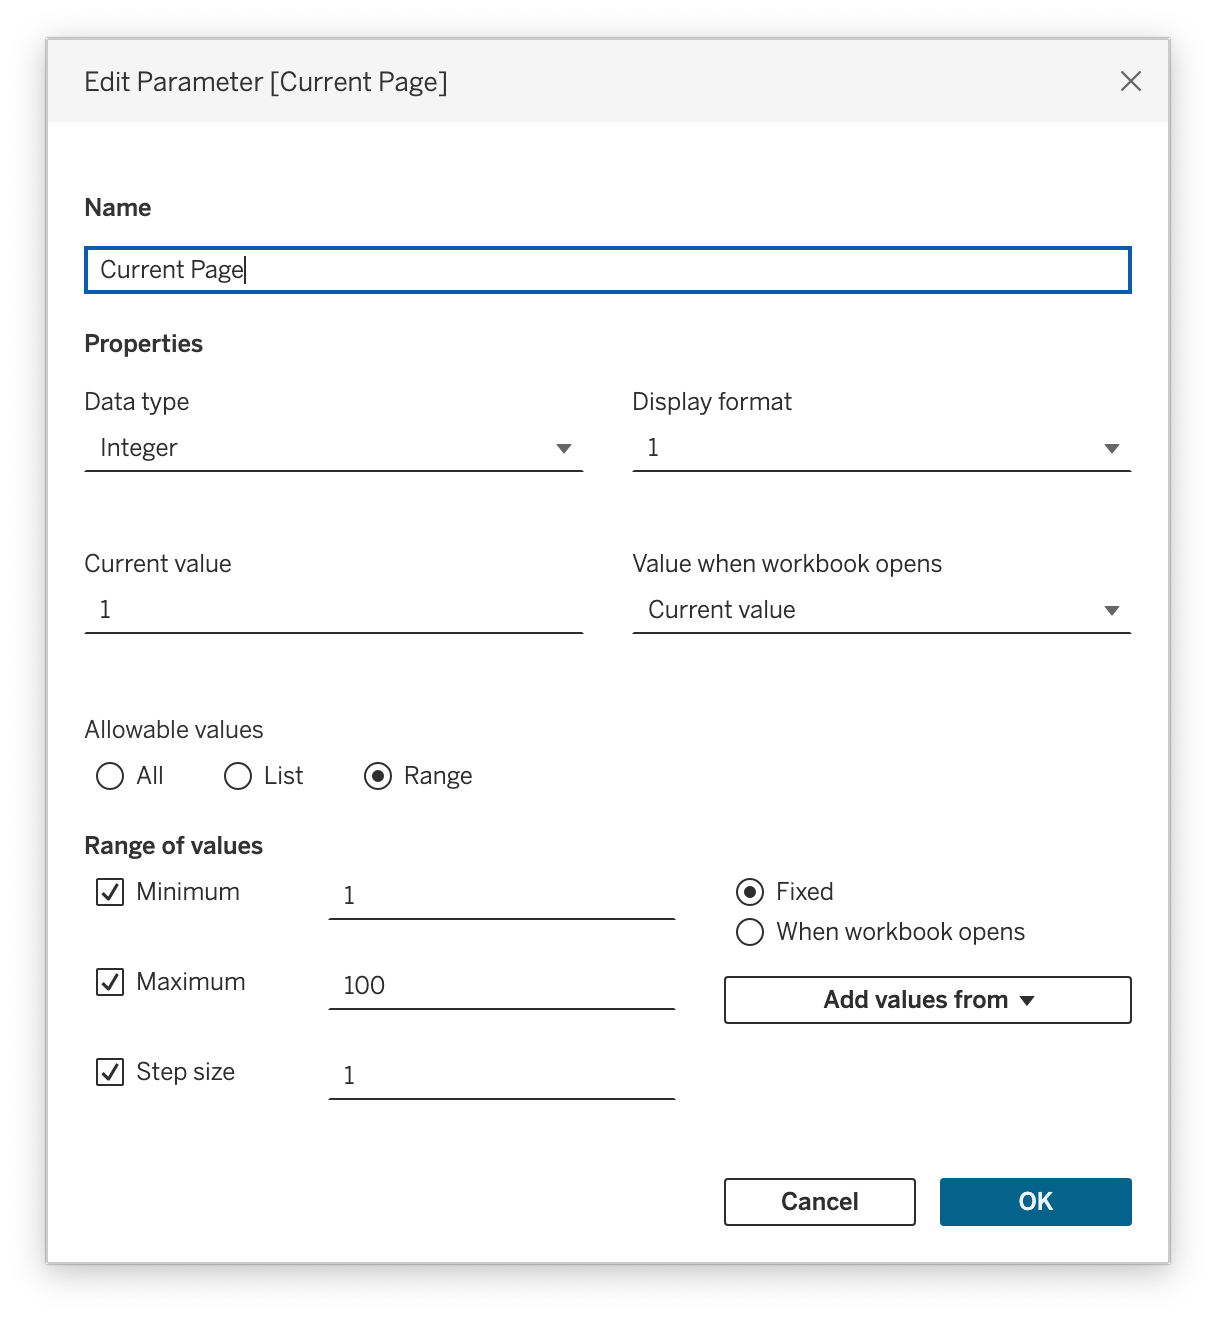
Create 2 parameters: Page Size and Current Page as below. You could choose a fixed value for page size, or you could make it a parameter to easily change it to the size until it’s fit for the design.

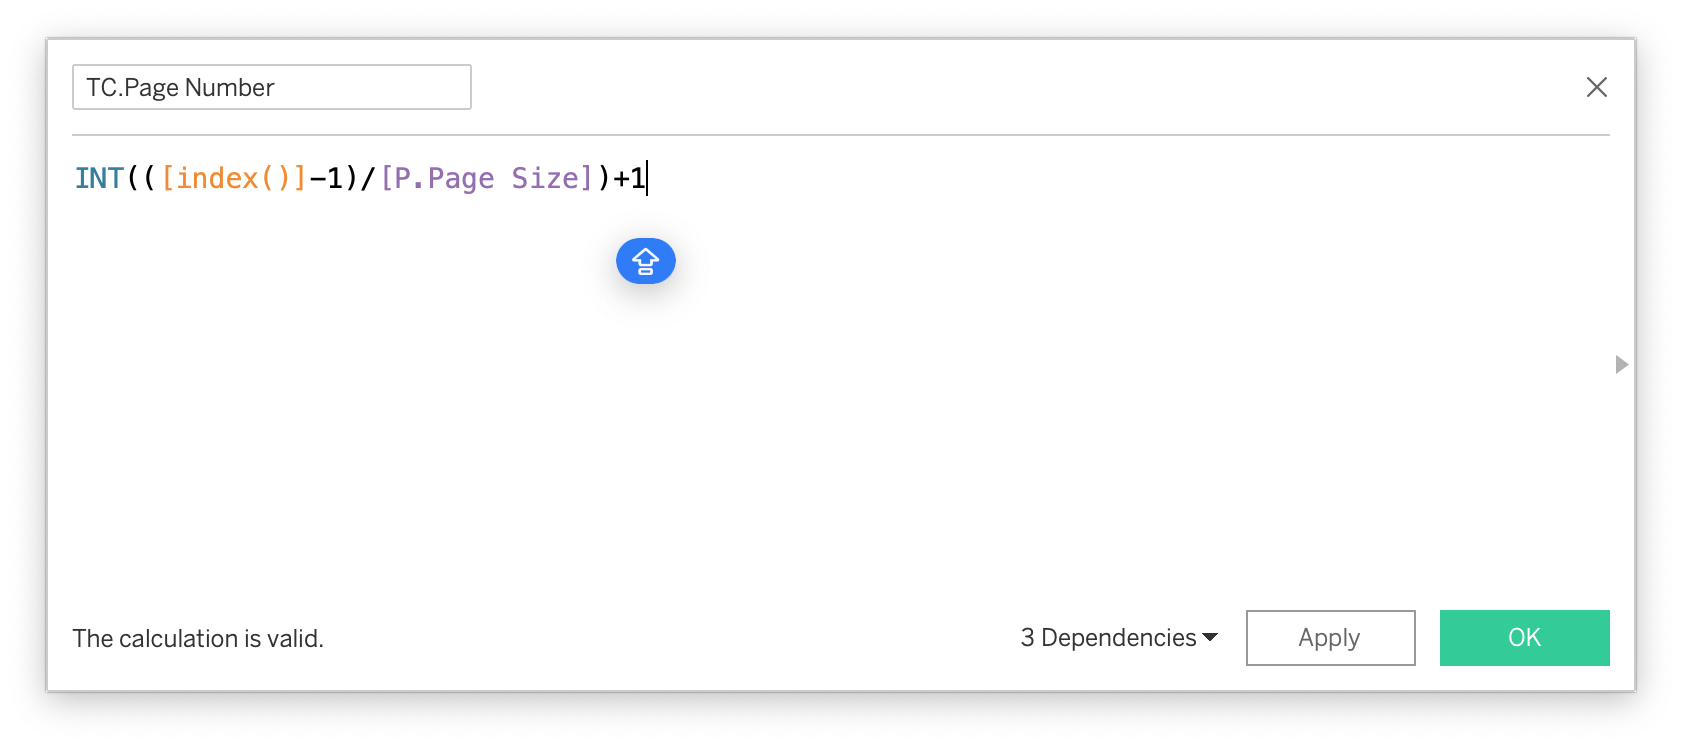
Using the parameters above to create calculations that get the real page number for each row based on page size you set up.
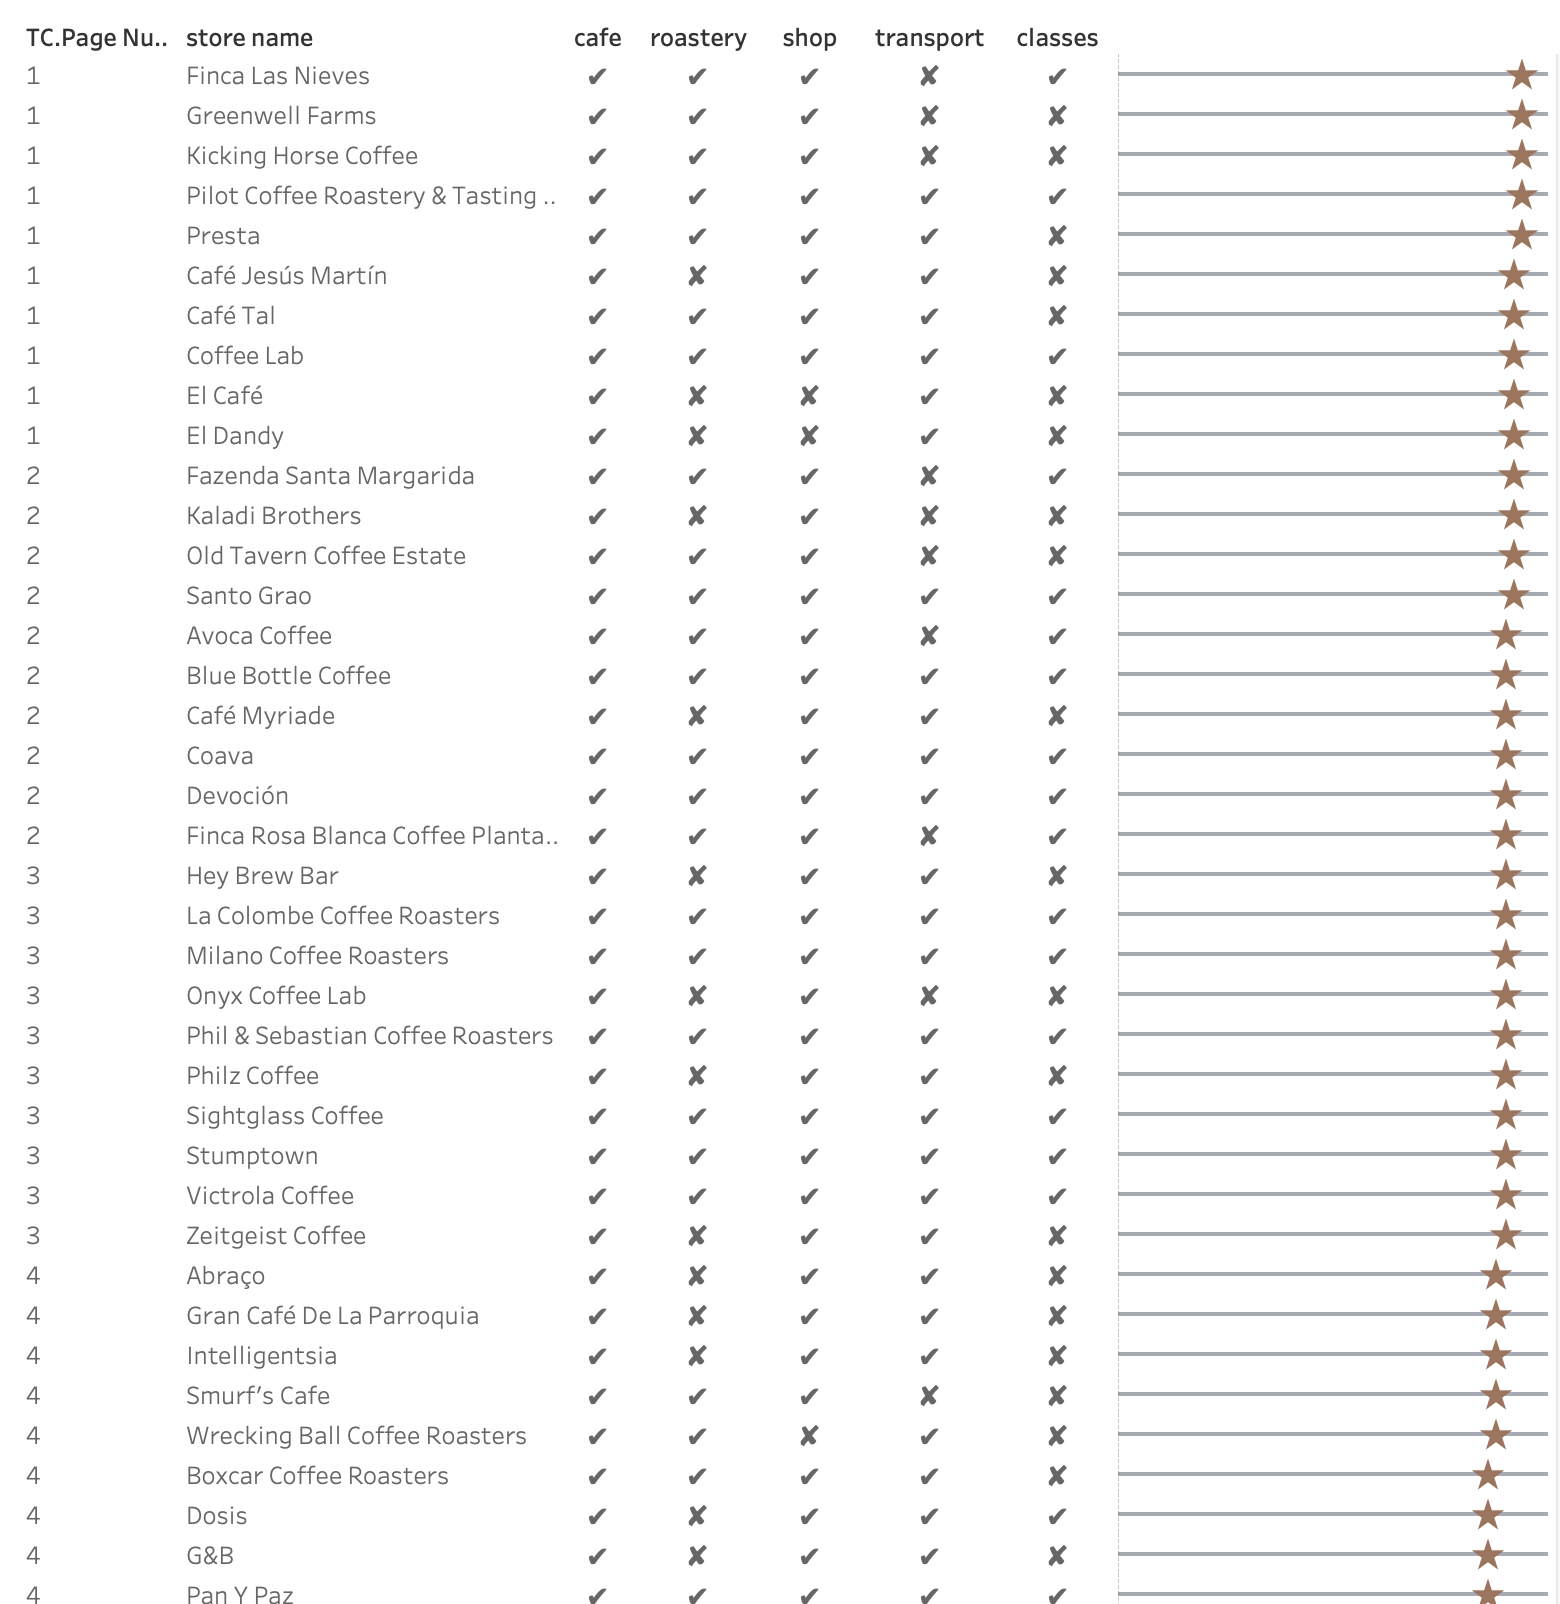
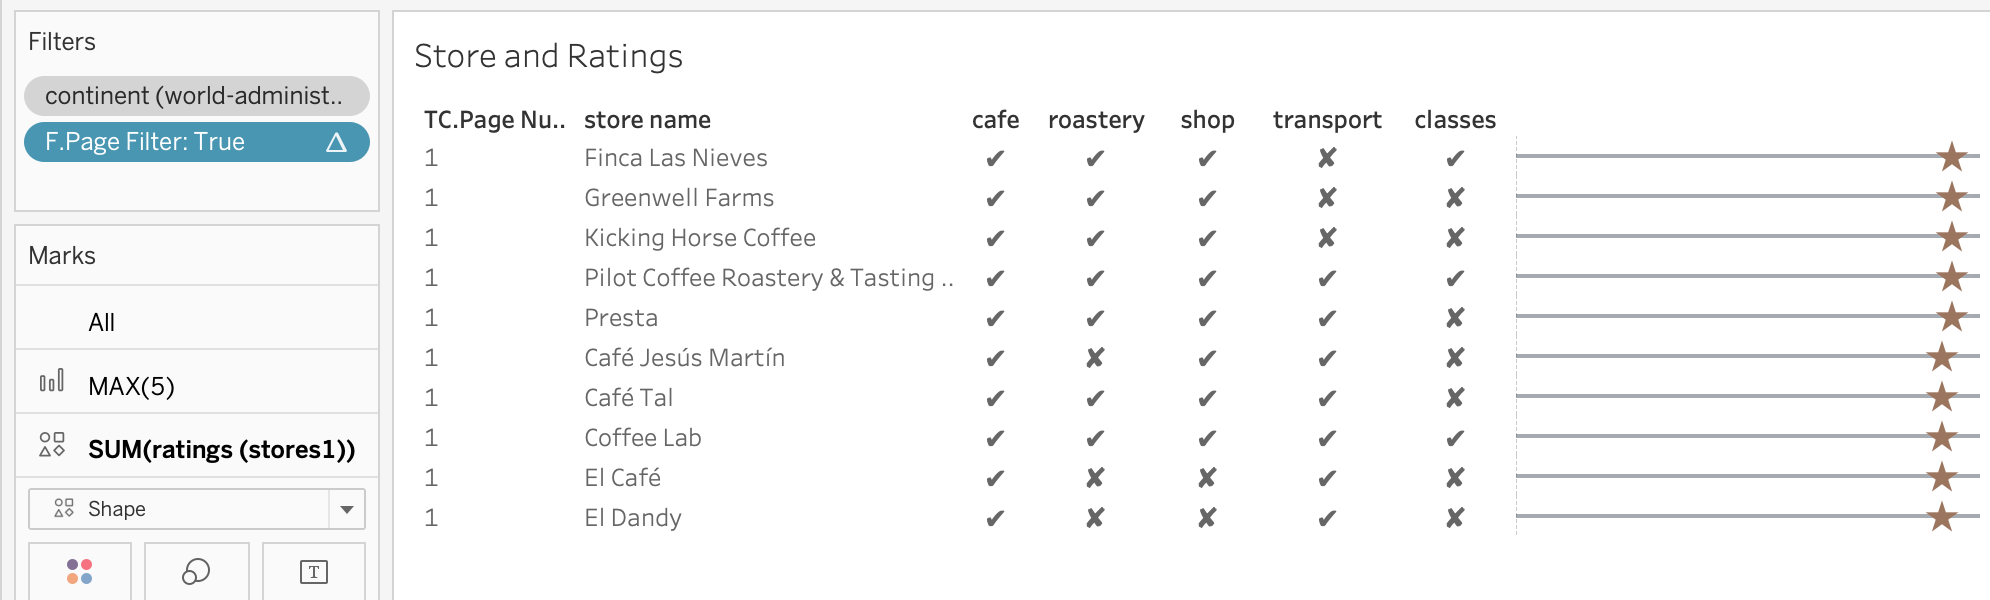
If you put it in rows as a discrete variable, you would see every 10 (aka page size) rows are assigned to the same value of page number, which can be used as a filter.
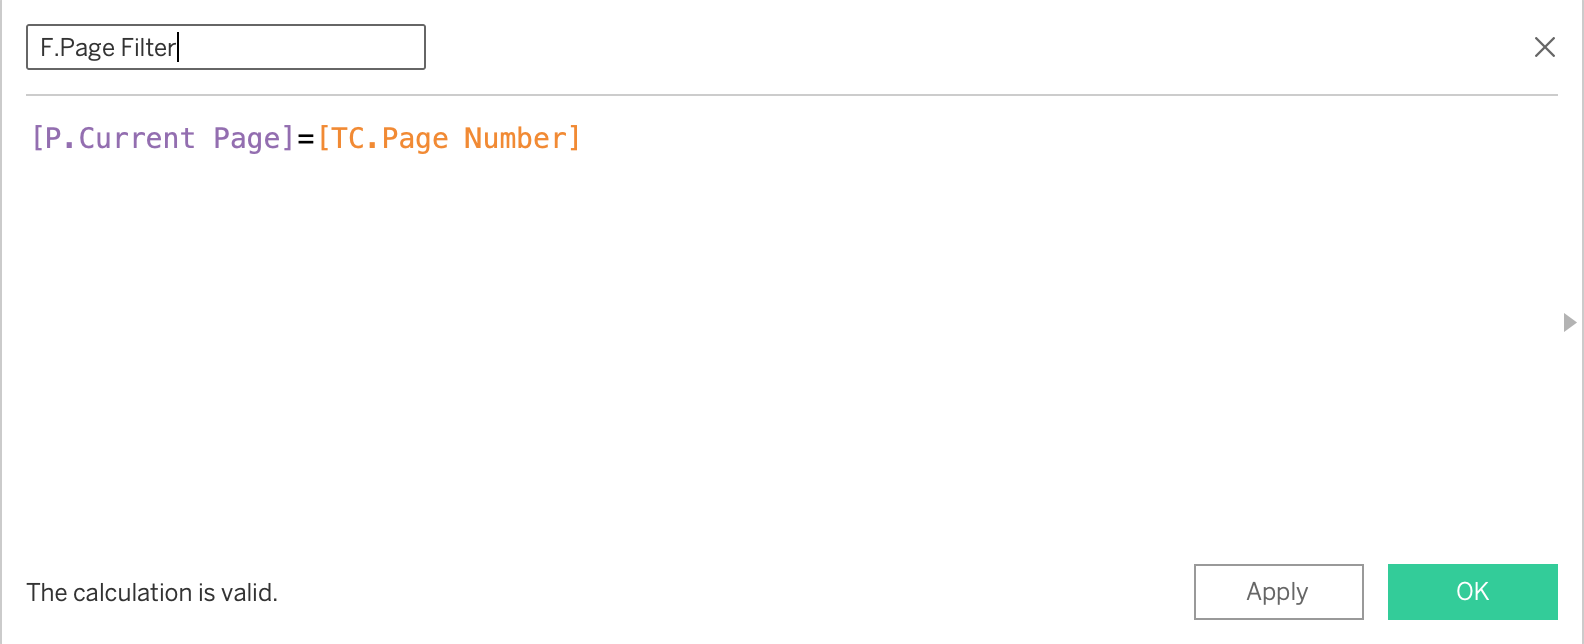
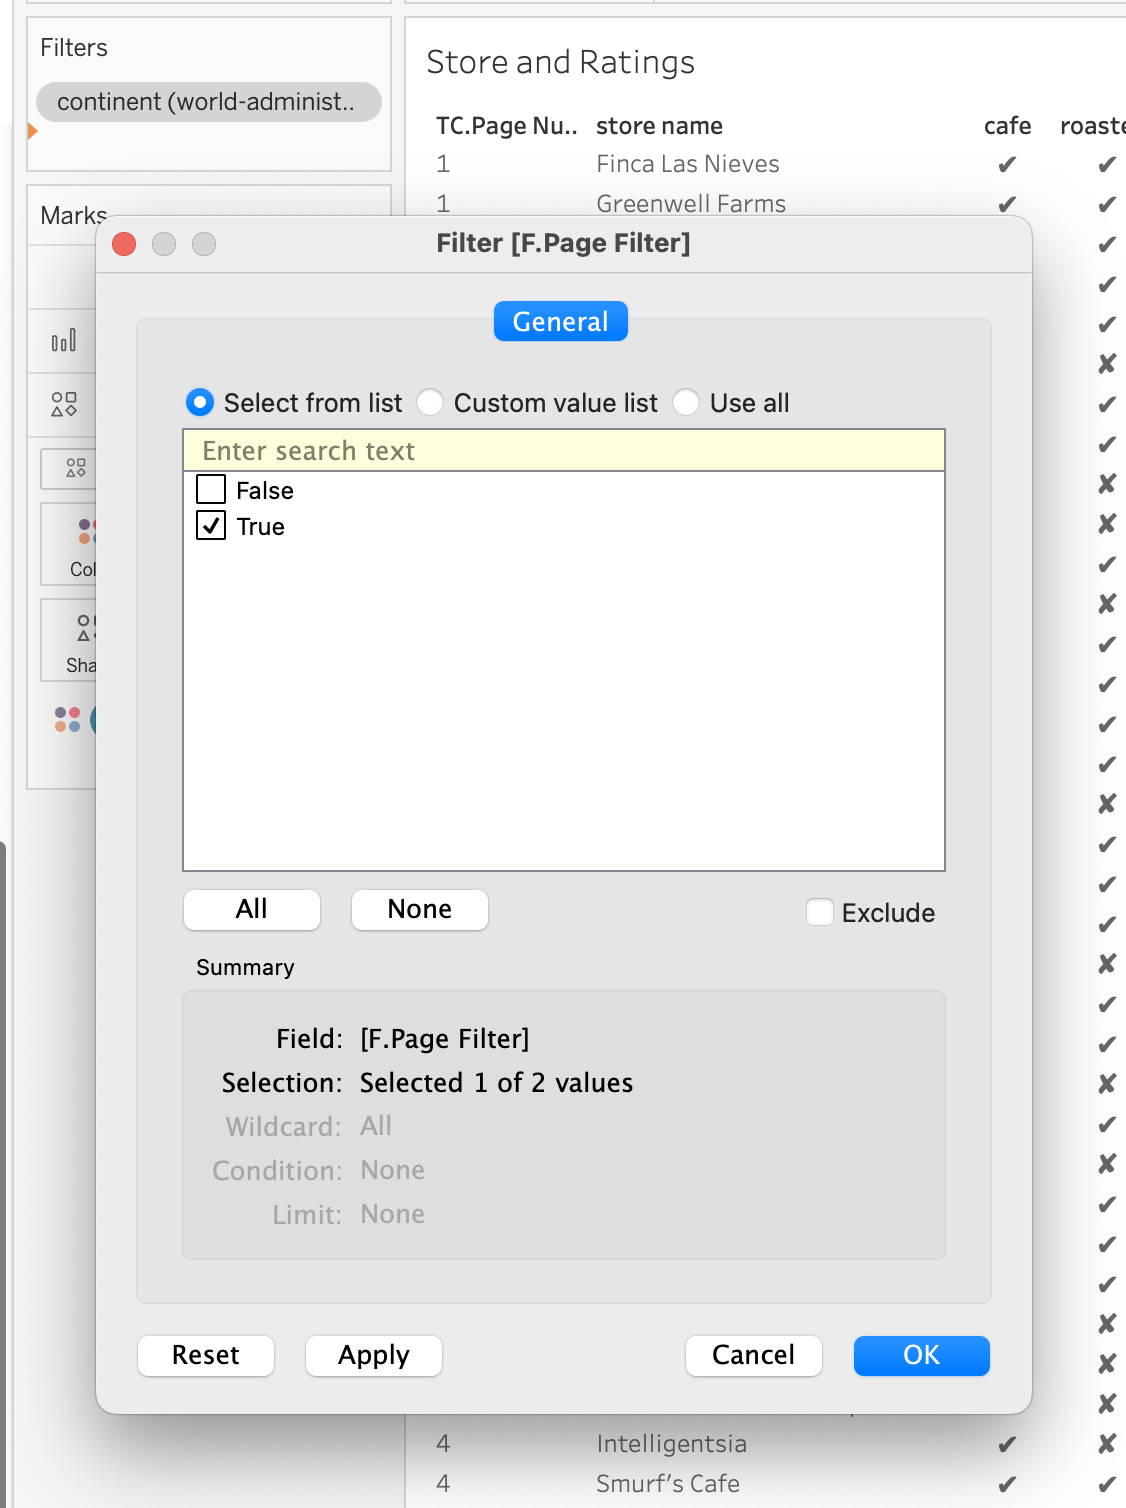
So to achieve this, create another calculation as a filter, simply by calculating whether the parameter Current Page is equal to the table calculation Page Number and returning a boolean.
If you now drag the Page Filter to Filters and select only True, you could see it’s exactly showing the number of rows as the Page Size.
Build the buttons
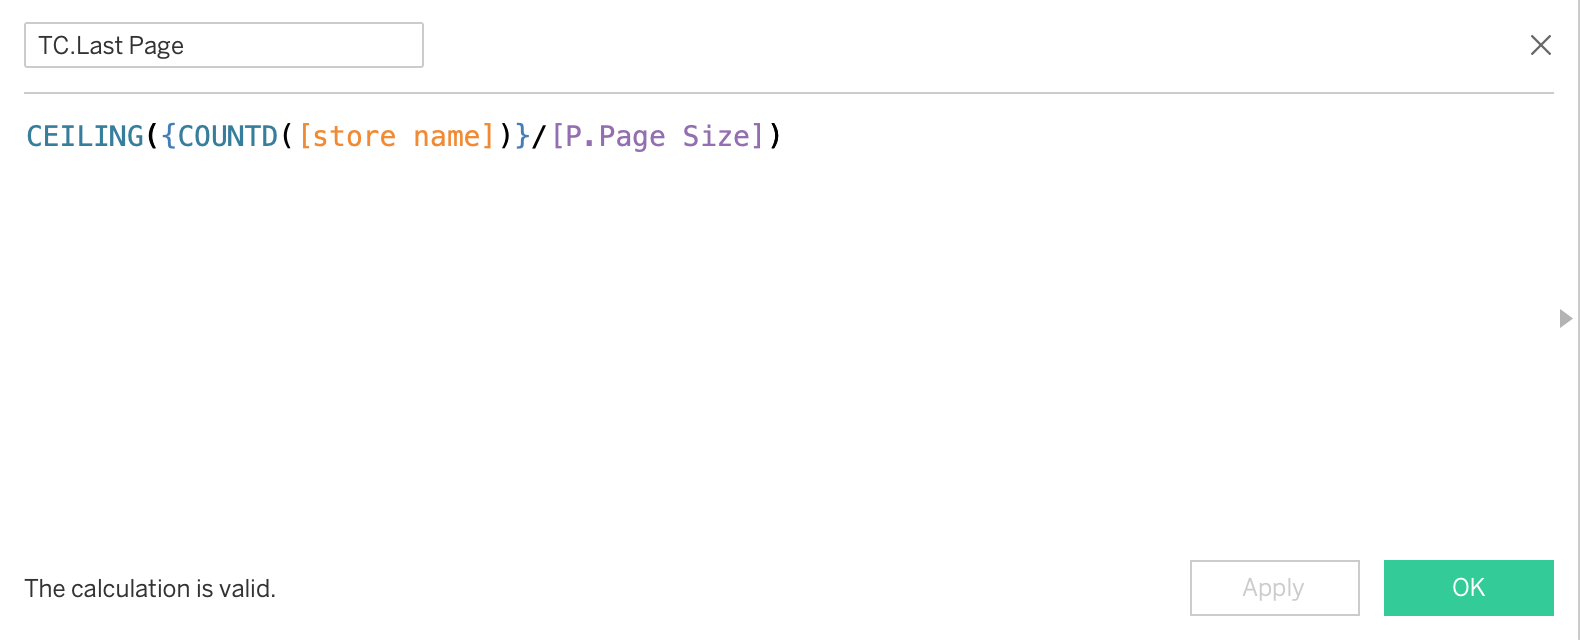
Firstly, you have to know which page number is the last page so that you won’t end up staring at a blank page.
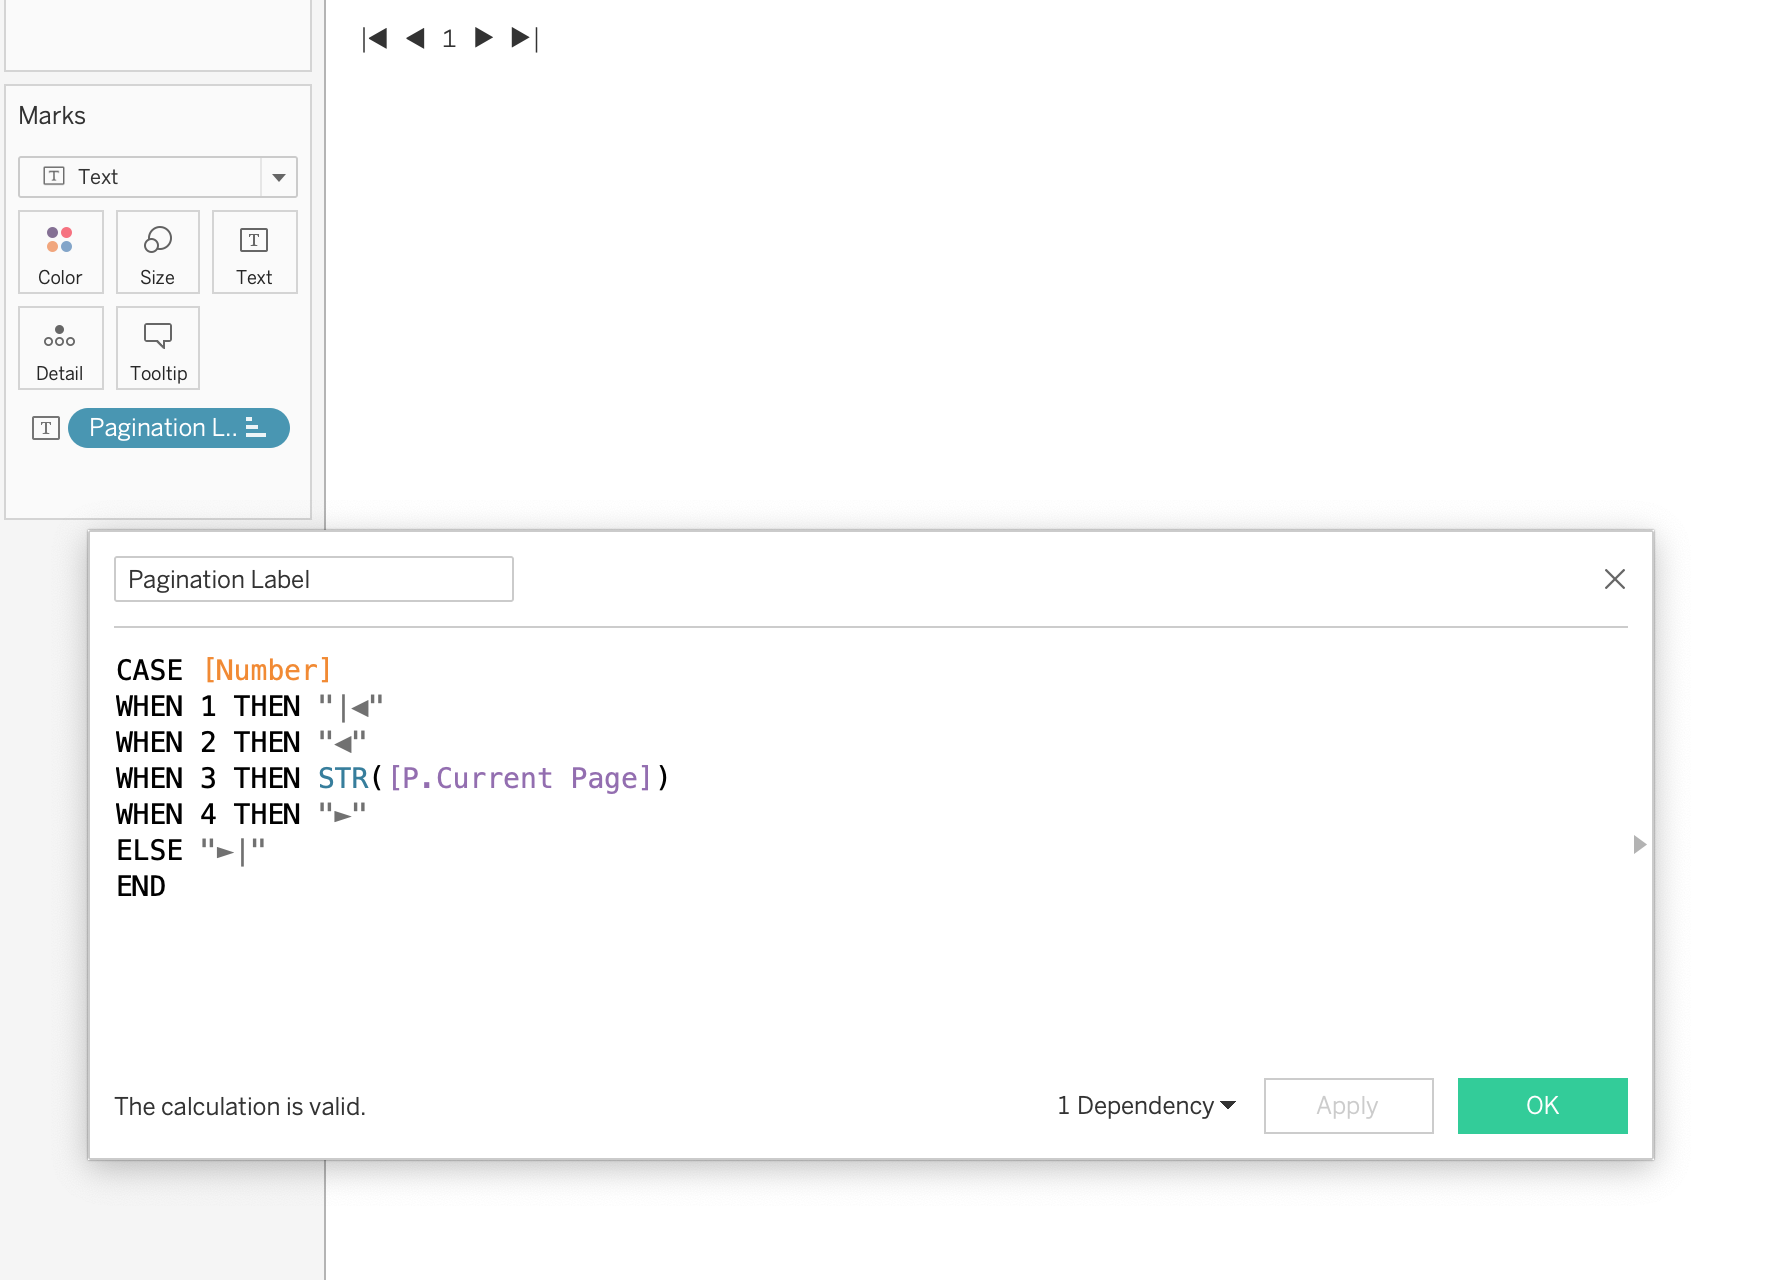
Next, the pagination label using a number placeholder.
What I want to achieve is a series of buttons that can do “return to the first page”, “to the previous page”, an indicator showing the current page number, “to the next page” and “to the last page”.
The first thing is to find a number placeholder that won’t be changed over time or filters. I made up a simple excel sheet and connect it with coffee store data.
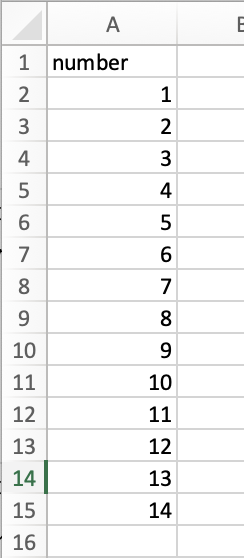
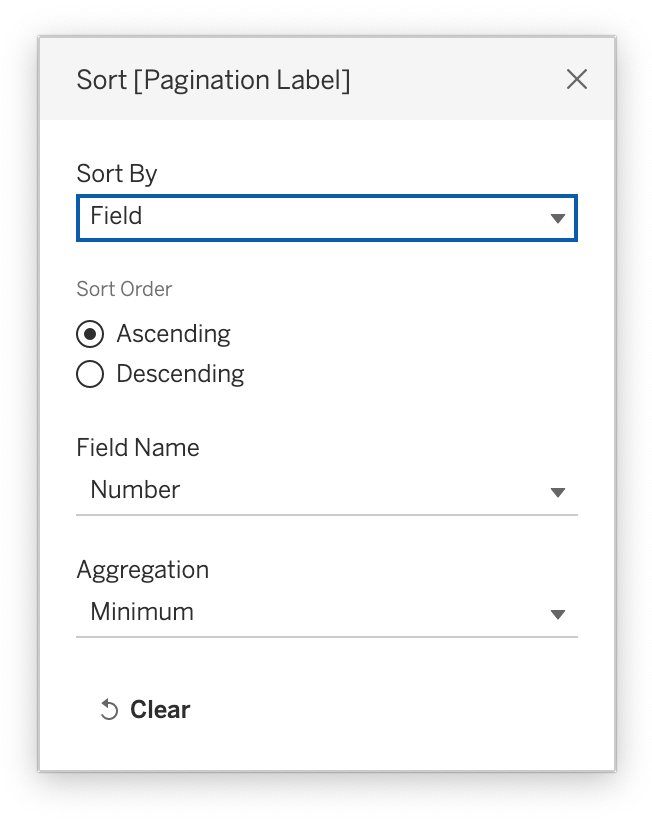
Using it we can create a calculation to give those 5 buttons a shape/number label. Sort the field ascending by Number (1,2,3,4,5).
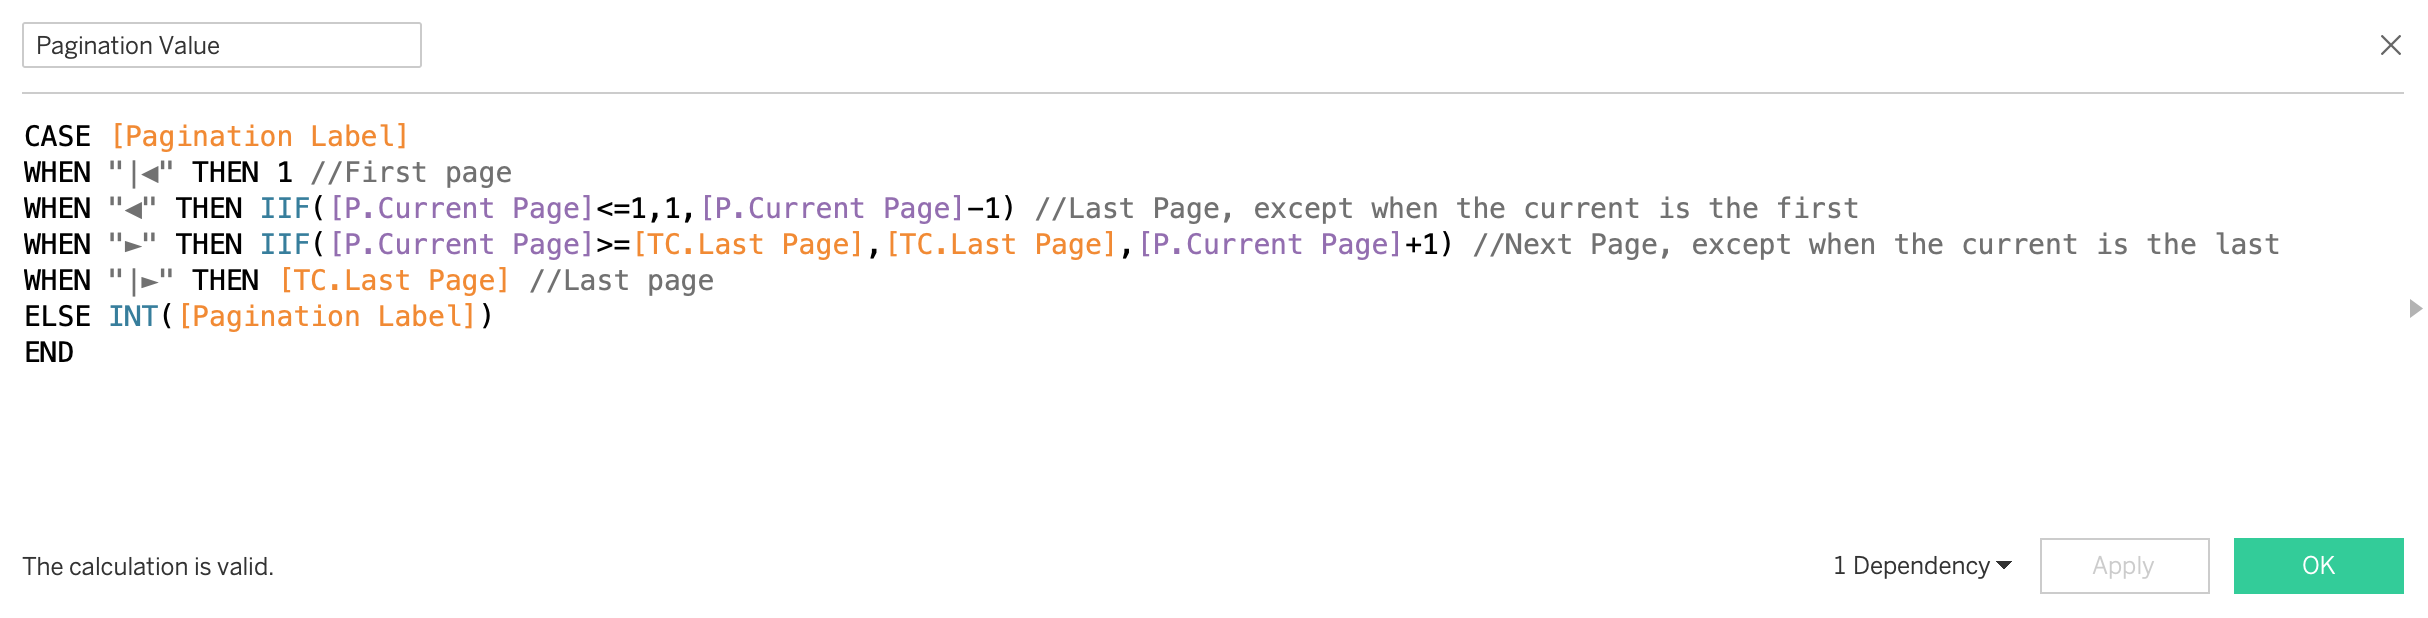
The buttons are correctly shown but each button should be assigned to a real value which can be used to change the current page number parameter.
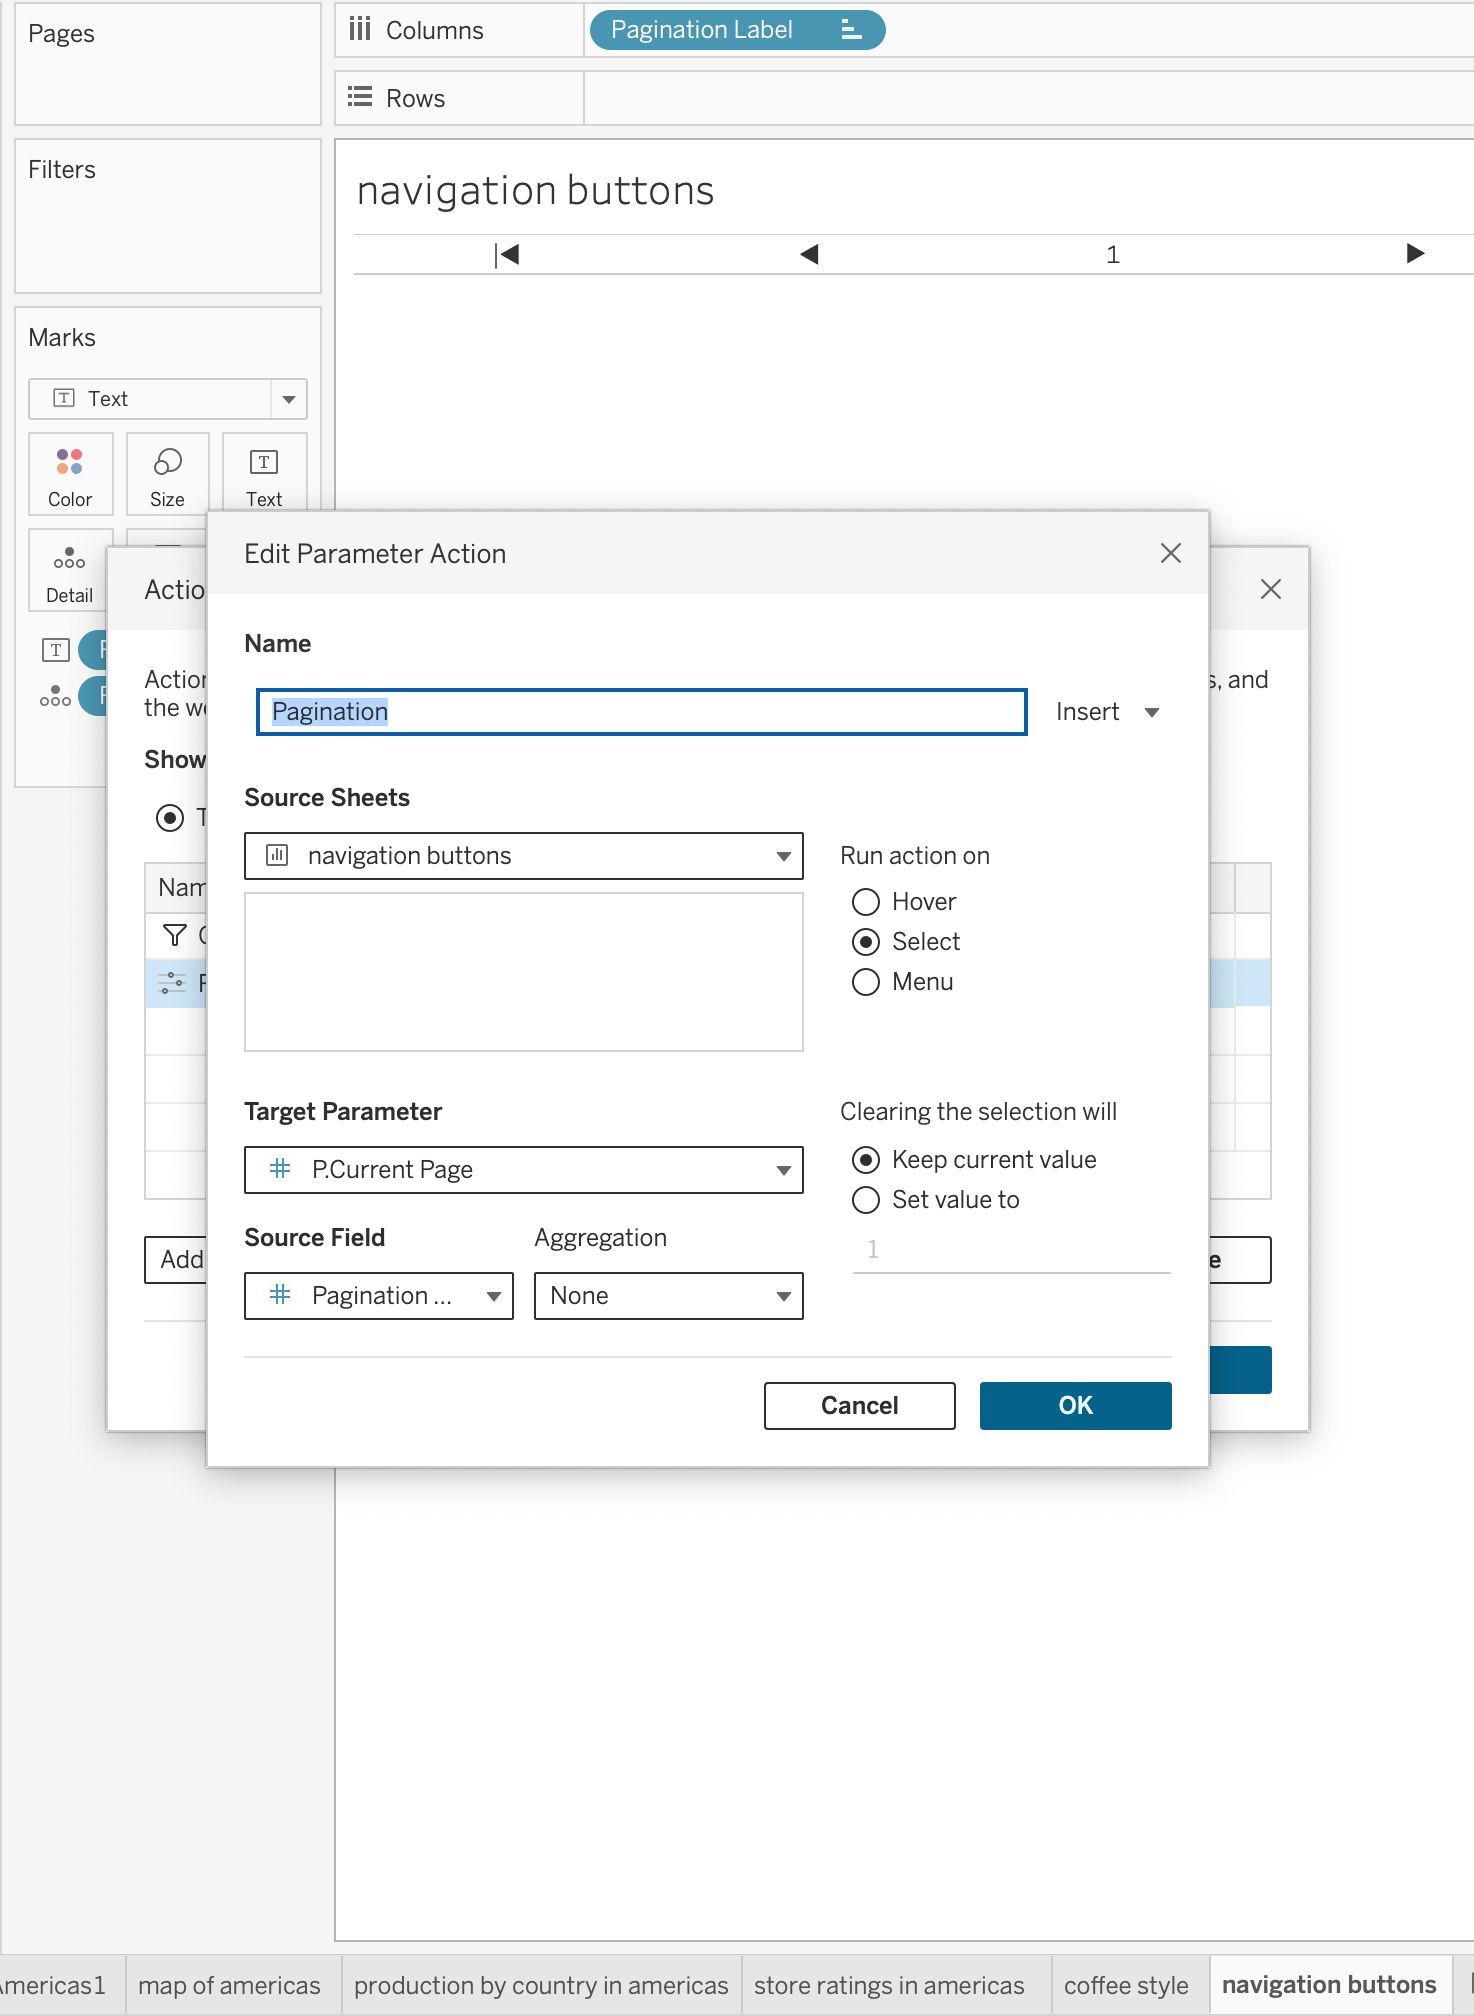
Set up an action to change parameter.
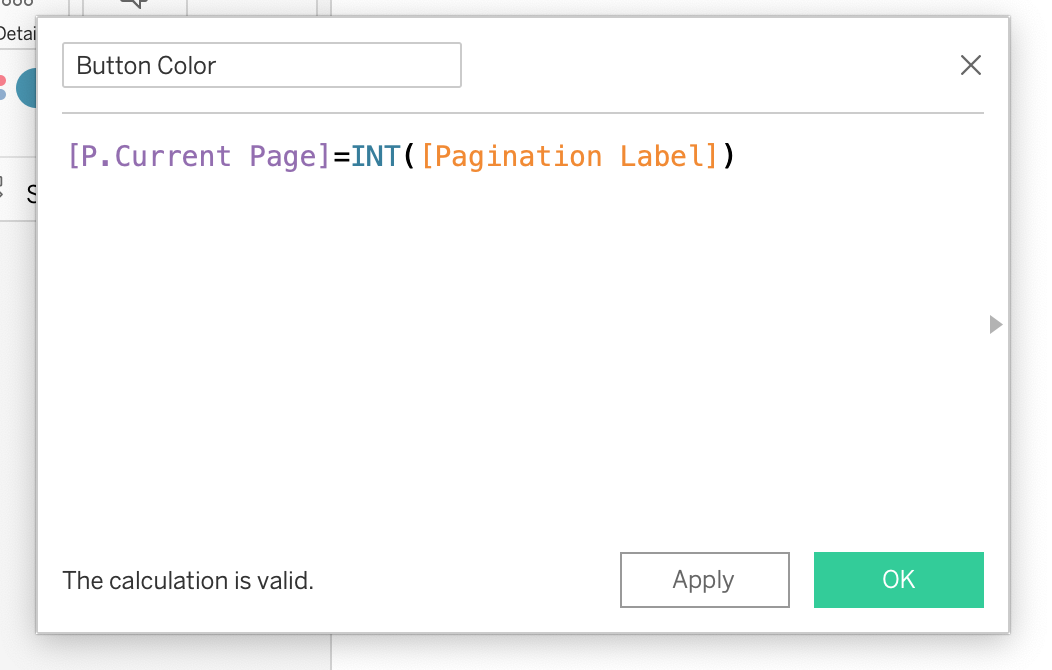
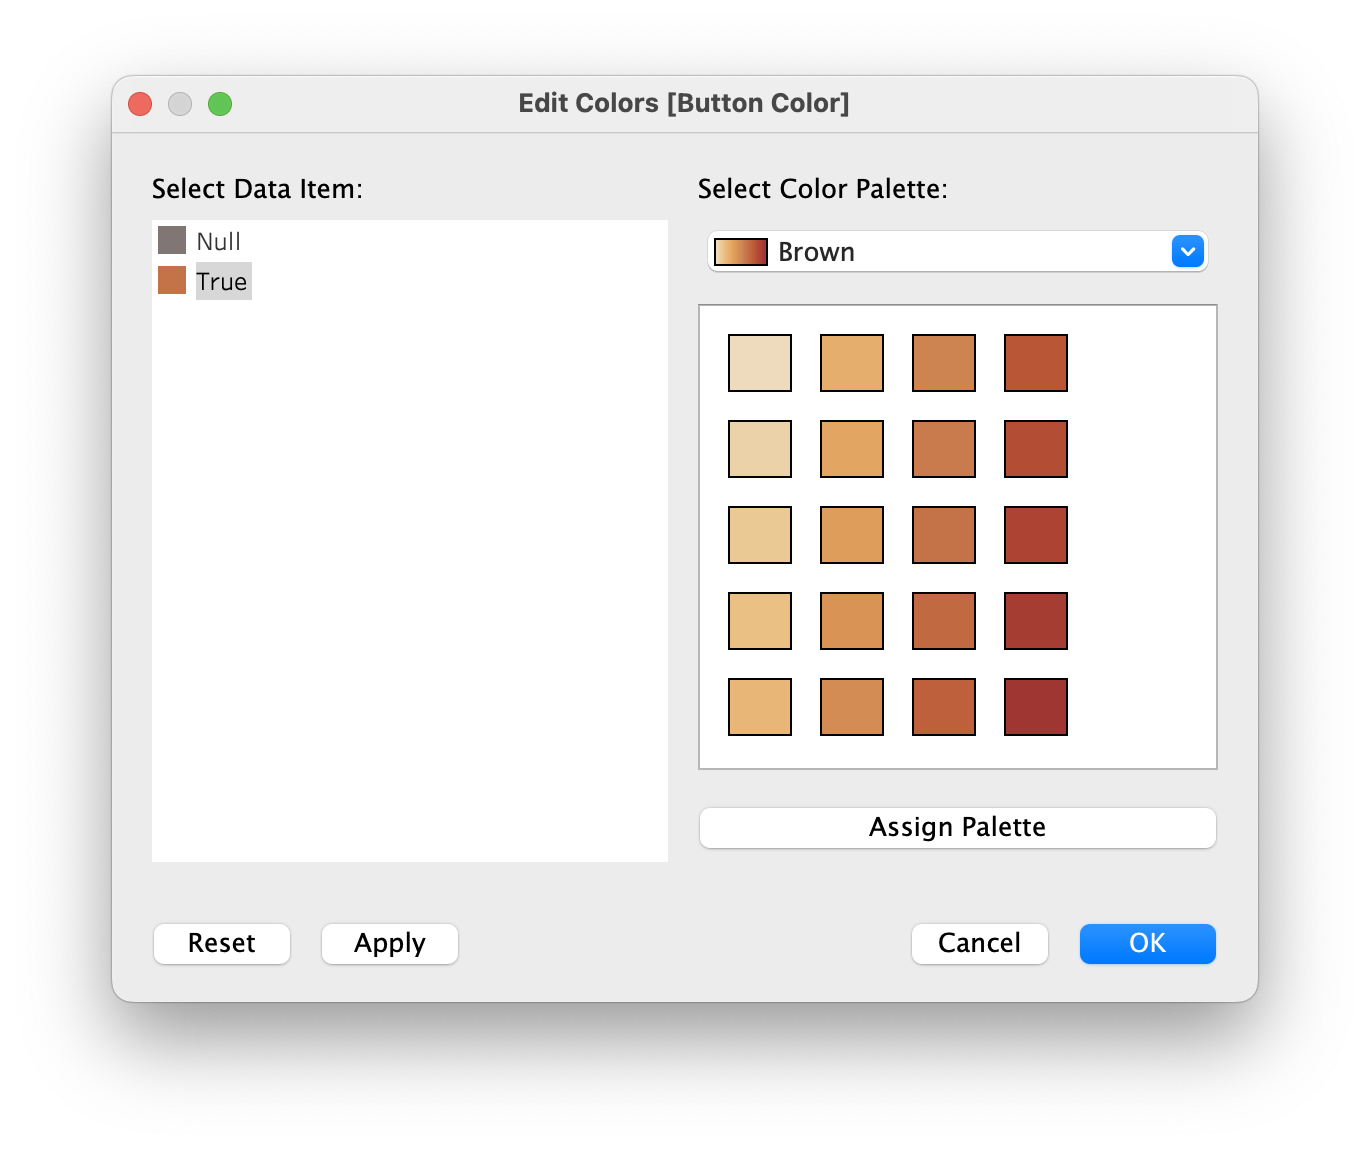
Create a calculation based on which we format the colors.
Everything is perfect, just as I imagined.
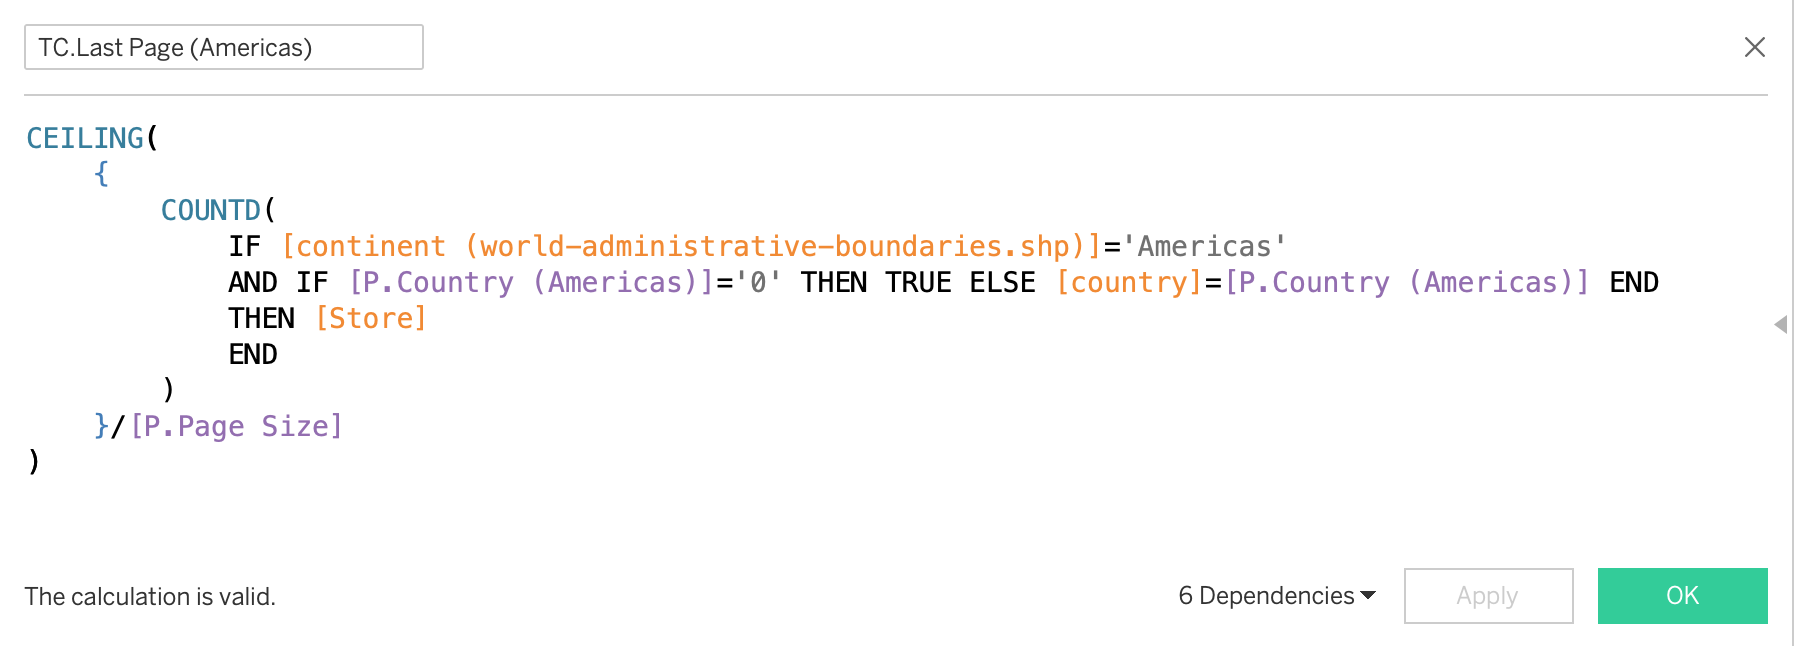
However, when I wanna interact with the map and let map control stores in which country show in the table, there’s a problem. Because I had to use a LOD when calculating the last page number of the table, it won’t work when any table filters applied. So I made a little workaround to filter country when clicking the country on the map. I added a parameter [country] in the calculations when calculating the page filter and last page number as below. I’ll do the similar tricks with other continents later.
# Layout design
Text containers:
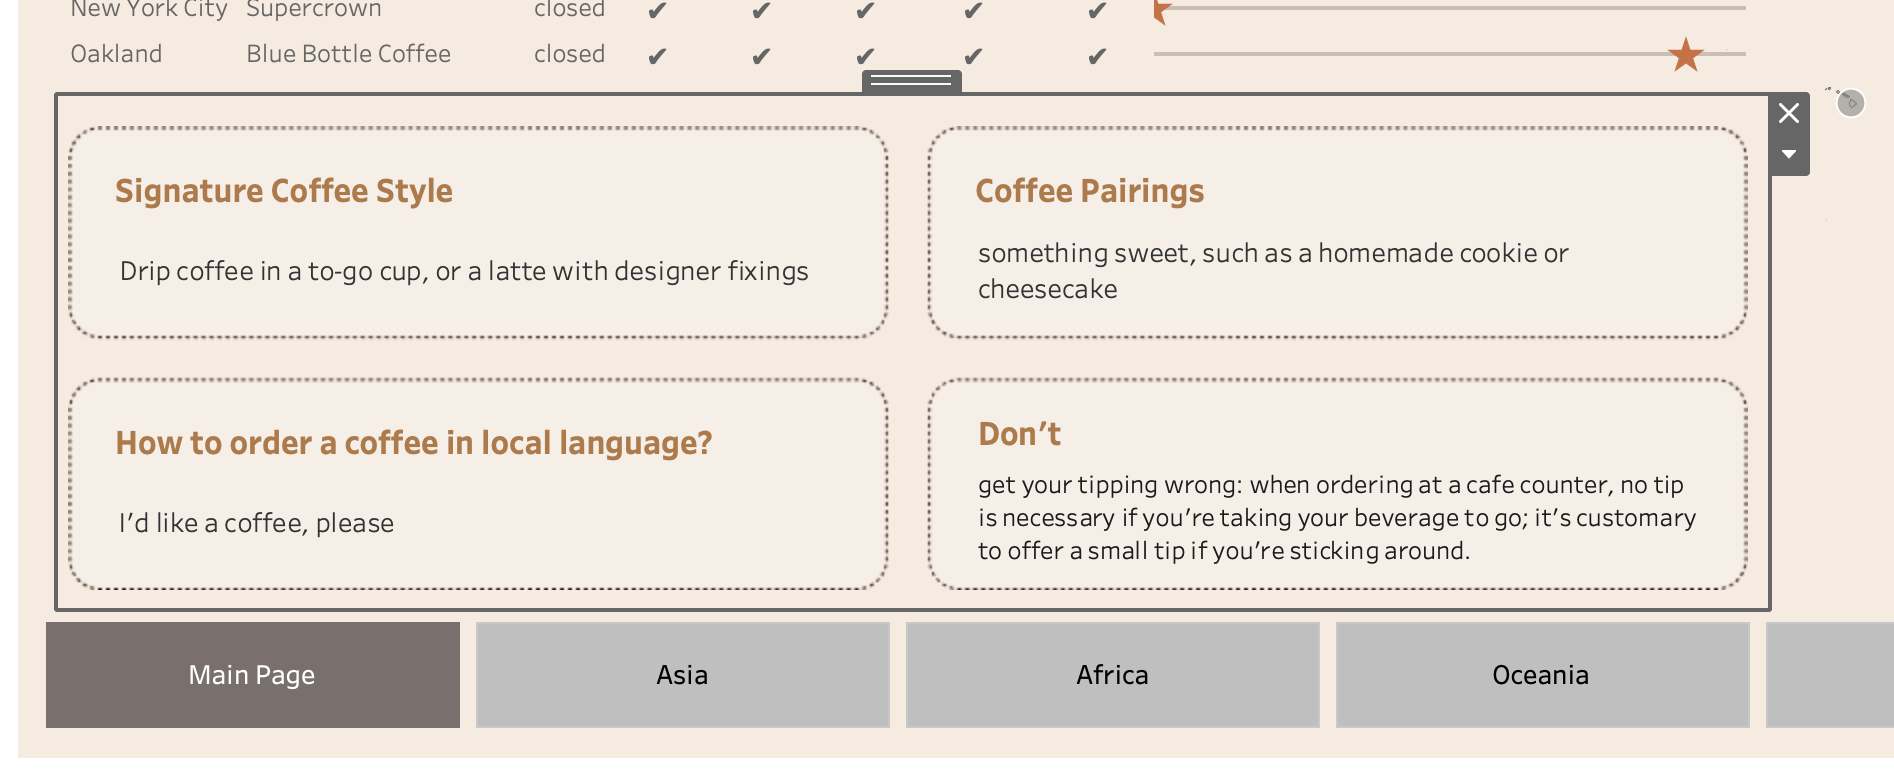
I’d like 4 containers to showcase each country’s coffee styles, coffee pairings, coffee languages, and preferences in words. What I had in mind is frames with rounded edges but containers in Tableau cannot do that. So I turned to Figma to draw it and export it as a png image.
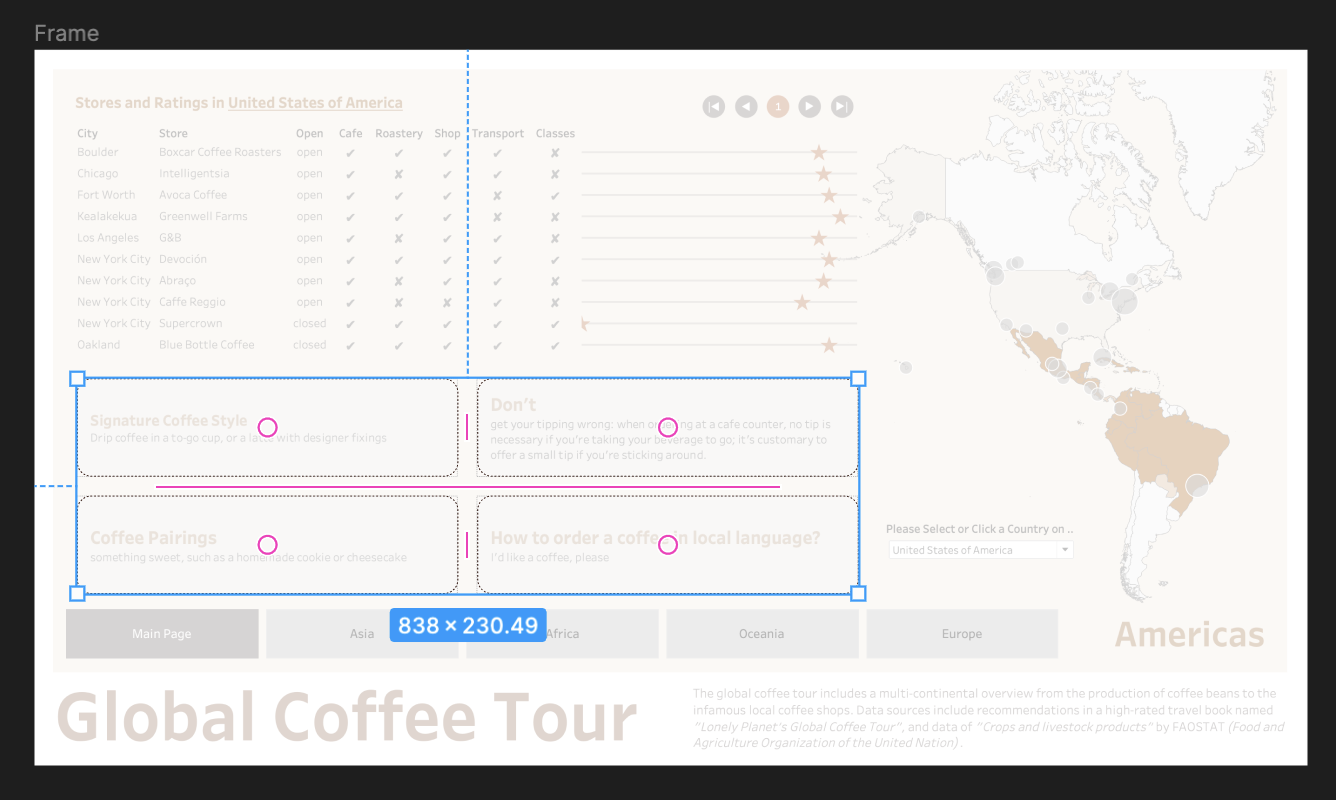
After adding it as a floating background image on Tableau, I put the text containers and text dashboards in it and then put a blank container floating above all so that users won’t accidentally click on these.
Map annotations
I planned to put a filter and some annotations around the blank space of the map to also fill up the space. So I screenshot every dashboard of the continental analysis and imported them in Figma. I drew arrows in it and export them as PNGs.
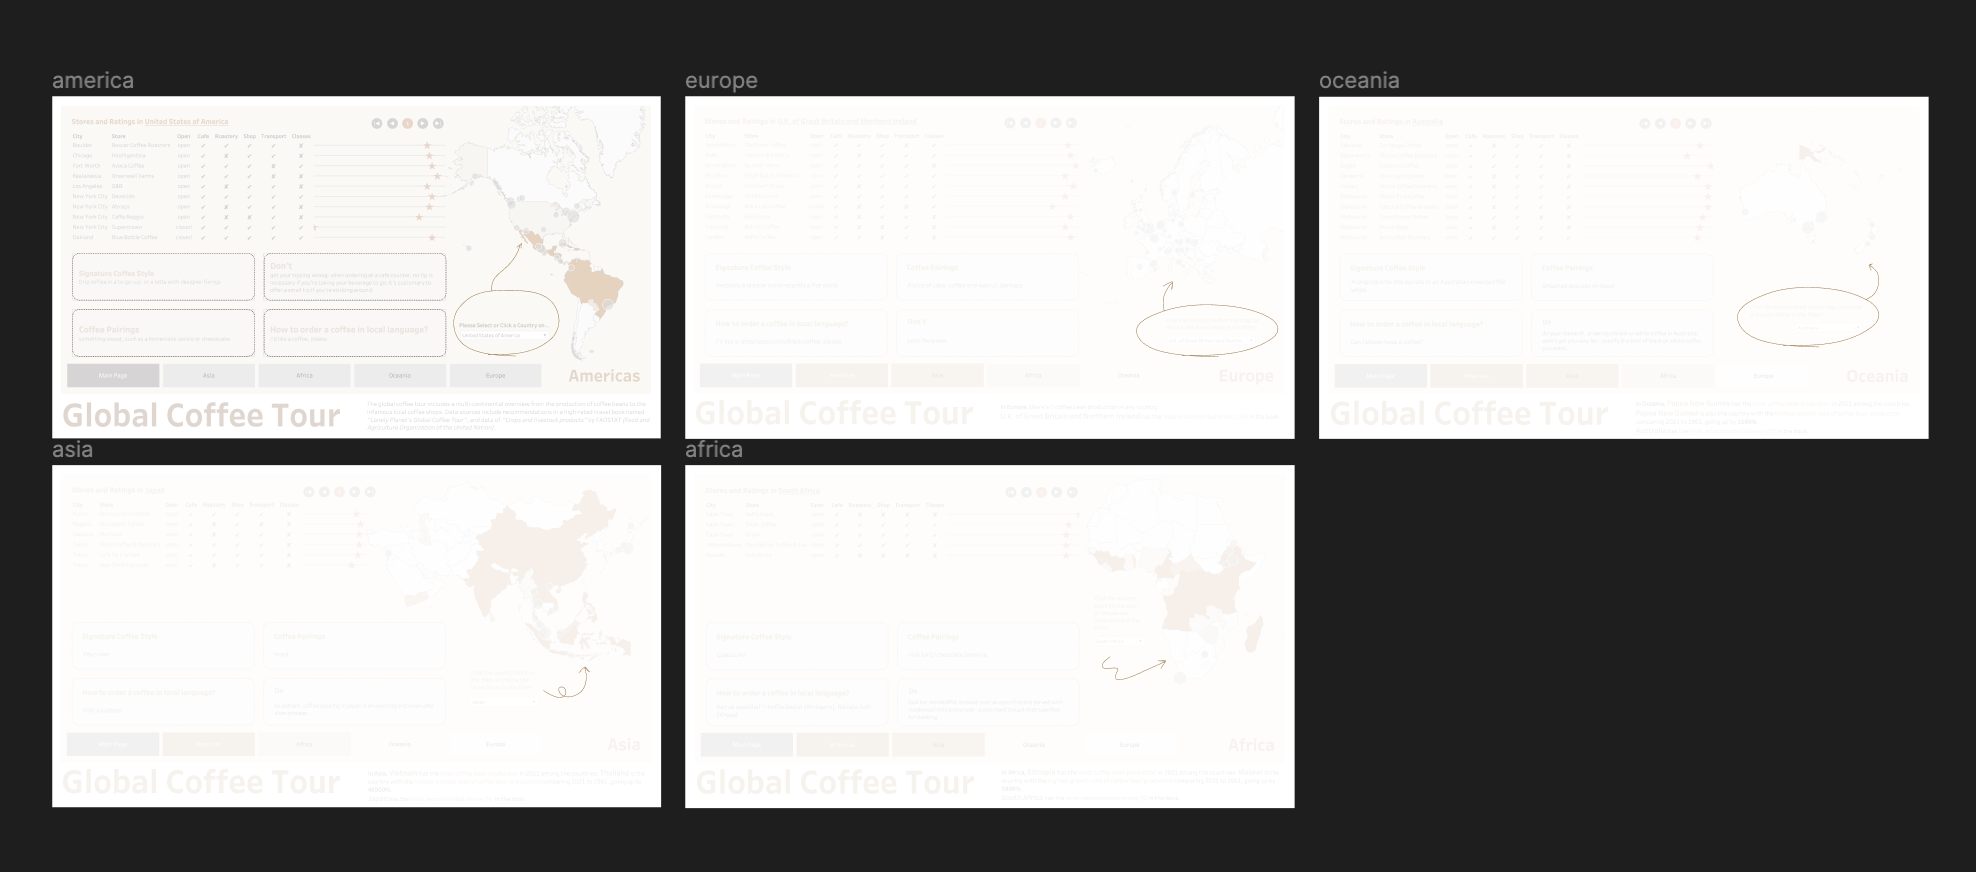
After importing them in Tableau, I put them at the exact spot I imagined in Figma and ta-da! It’s finished!